本节内容,来自Profile and optimize your game's memory
关联阅读:
In the last few years, our teams have been working with game developers like you to understand and improve game memory together.
Today, we want to share our learnings, so you can also have a head start when you debug your game's memory and create awesome games with the best player experience.
We're going to break down memory usage in your game, from both CPU and GPU objects.
Plus, analyze allocations in your game, actual use on physical memory, and references between objects.

Because there are many facets of memory, our developer tools also reveal memory mysteries from different angles.
We'll take a guided tour, and experience how we use all of them, including Xcode, Instruments, and command line tools in Terminal.

In today's guided tour, we will begin with a prelude to understand game memory.
And start to profile memory and memory growth, where Seth will tell us about Instruments.
After taking the temporal approach with Instruments, we will further our journey, and analyze the memory graph of your game using tools in Xcode and Terminal.
These workflows focus on the current state of memory use, and the breakdown of the total game memory.
Finally, Seth will share how you can use Metal Debugger to optimize Metal resources, which is a somewhat standalone, yet core area in game memory.

Now, let's start rolling with understanding game memory.
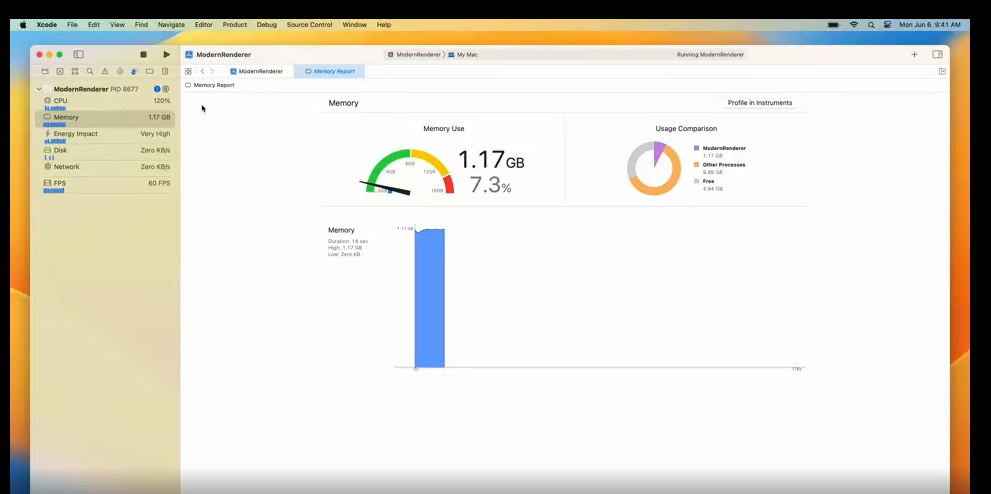
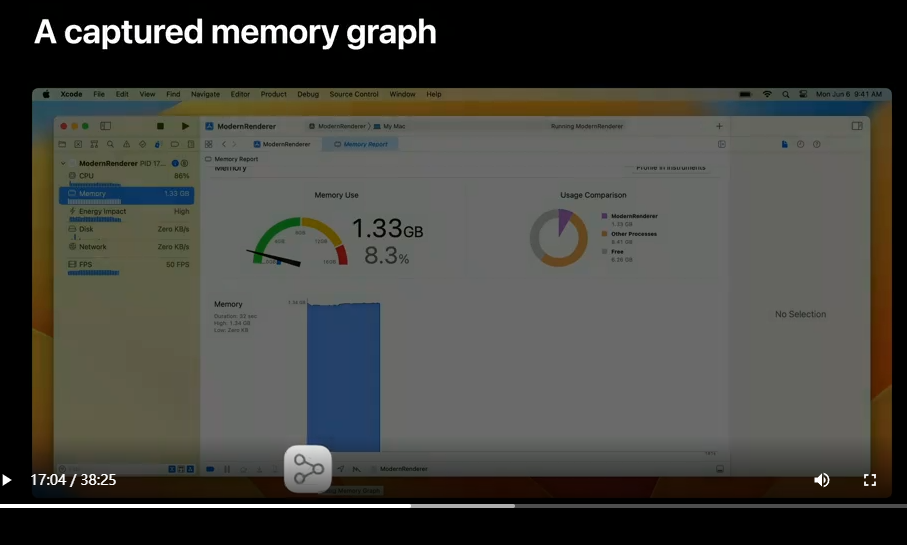
When you launch your game from Xcode, such as the Modern Rendering with Metal sample code, you can open this Memory Report in Xcode's debug navigator.
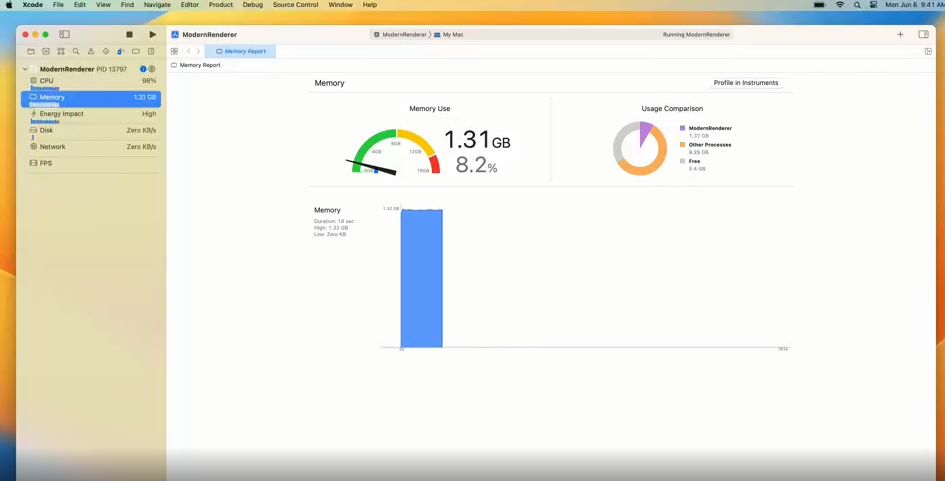
It is your first view on the game's current and recent memory usage, and its impact level on the system.
The number on the gauge shows you the current memory use of the game.

An important first step in memory debugging is to understand what this number means.
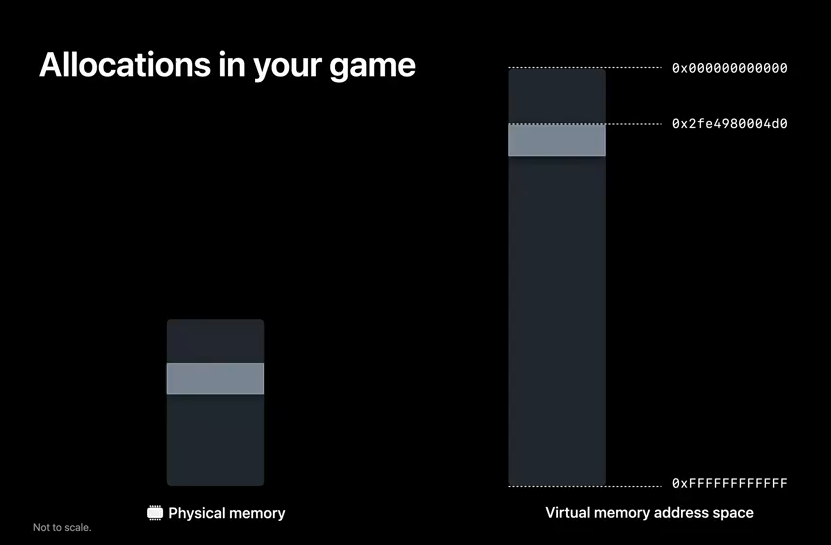
To put it in one line, actual memory use in your game is not the same as allocations.

Actual memory use is on physical memory.
While allocations is the memory requested by the game, on the virtual memory address space.
And different kinds of allocations are naturally calculated separately.
When your game allocates memory, those new allocations do not immediately nor directly take up space on physical memory.
On the contrary, they will reserve some space on virtual memory address space, which the system provides for each process.
And when the program actually uses this allocation later, will the system prepare space on physical memory.
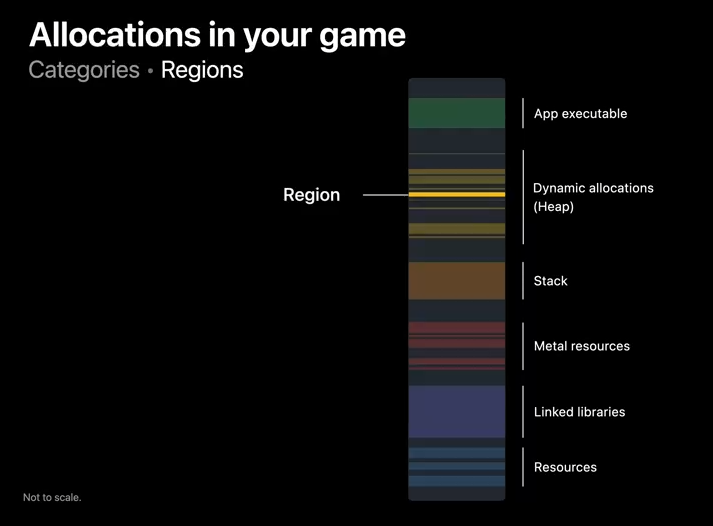
Allocations of the same kind are grouped into categories, and sparsely occupy the virtual address space.
These categories may include: the program's executable binary; all the libraries and frameworks; the stack, providing storage for local and temporary variables as well as some function arguments; dynamic memory regions also known as heap; including class instance storage and memory the program manually allocates; regions mapped from read-only resources such as game asset files; and of course, Metal objects in your game, such as buffers, textures, and pipeline state objects.
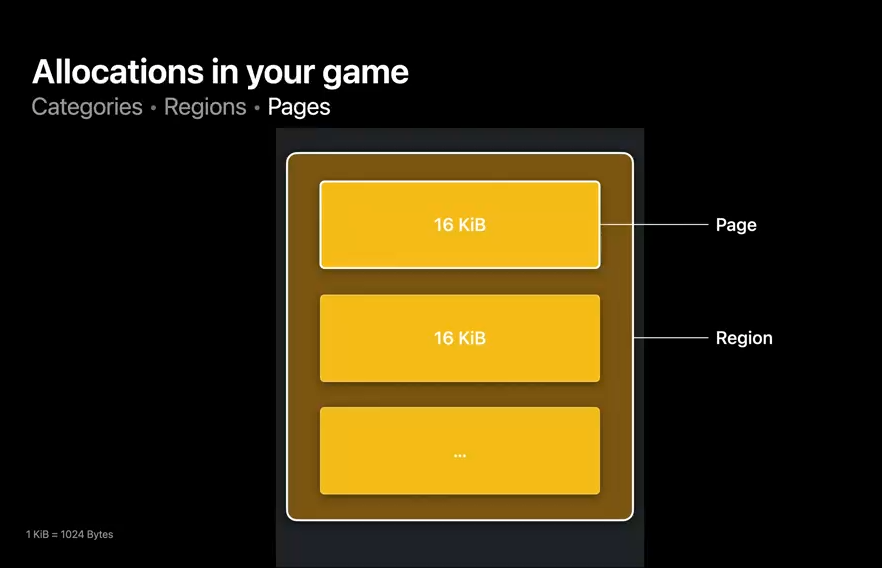
And these categories are made of regions.
Under the hood, memory operations work at the granularity of memory pages, which are 16 kibibytes each on modern Apple devices.
This means each region takes up one or more pages, and is at least 16 kibibytes large.
As the game continues, the state of its memory keeps evolving; new objects get allocated, old items get destroyed, the regions keep changing.
But only used pages on the regions are on physical memory, which the system diligently charges to your game, as to any other apps.

Memory pages in your game can be one of three kinds: dirty, compressed, and clean.
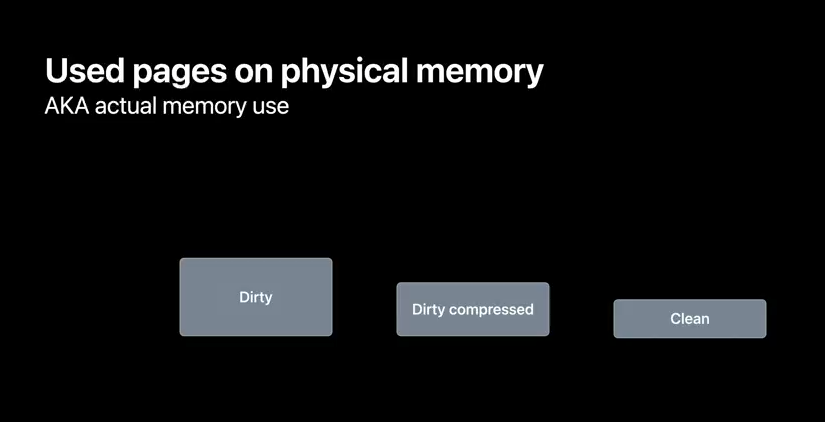
Let's check out what they are.
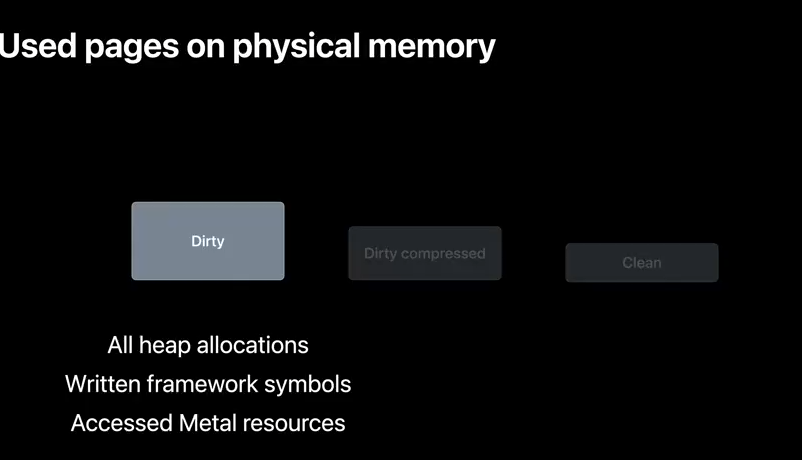
Dirty memory pages includes memory that your game has written to.
This includes memory allocations in heap, and frameworks, once your game modifies those variables or symbols.
On devices with Apple silicon, accessed Metal resources also fall into this category, this is because CPU and GPU share the same pool of fast unified memory.
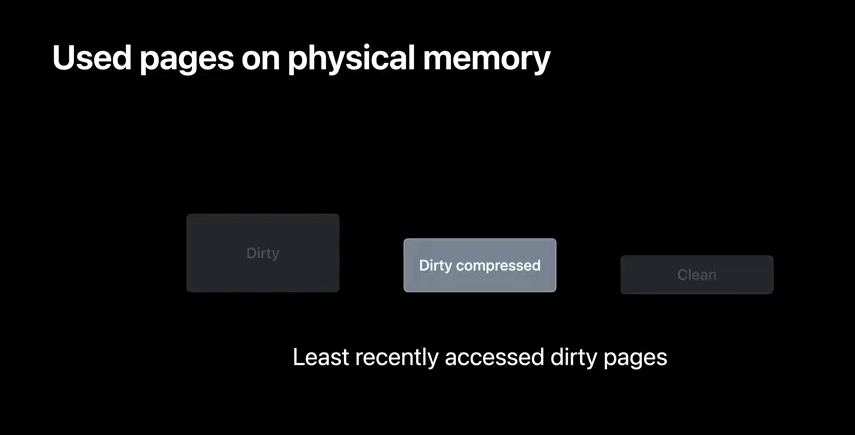
However, if some dirty pages are not used for a long time, the system might reduce their presence on physical memory by compressing these pages or storing them on flash or disk, which we call swapping.
This will allow the device to run more apps and services.
Later, when your game asks for these pages again, the system will decompress or page in them from disk.
Note, your game will still get charged for their uncompressed size.
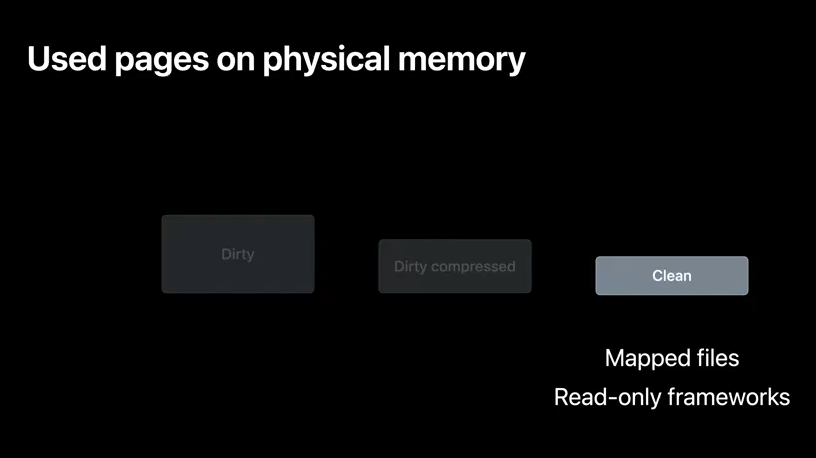
For clean memory pages, they include read-only files mapped from disk, such as texture or audio assets, and frameworks loaded into the process.
The system can empty or reload them from disk at any time, so they don't count towards your game's memory footprint.
However, they may be resident on memory, and excessive use will slow down the system and your game.
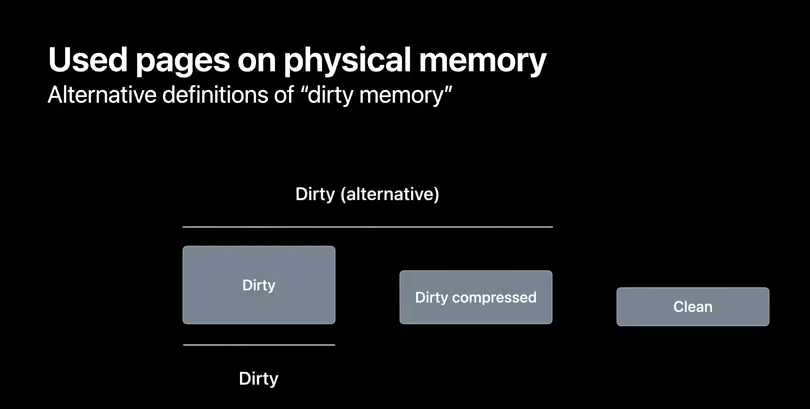
It's usually the most interesting to look at the first two parts, which combined, we call memory footprint.
And the system uses this to enforce memory limit.
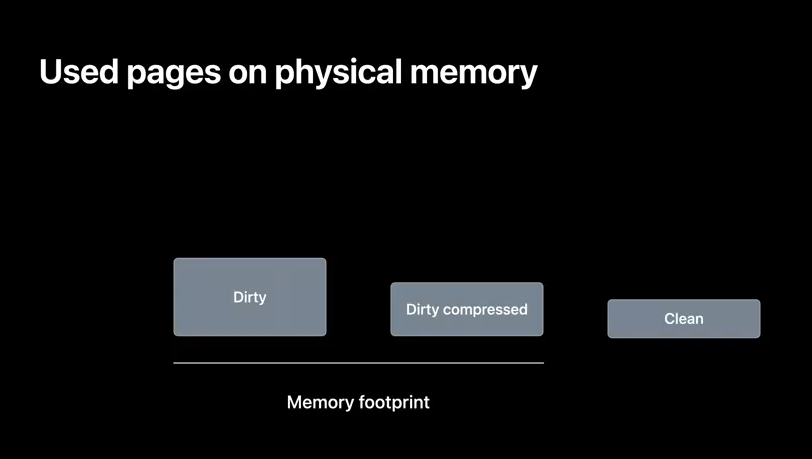
In some terminologies, people say "dirty memory" when they mean memory footprint, as dirty is the opposite of clean.
But don't worry, when things become fuzzy, we will call out which one we mean.
So now you know how memory works, and how system charges it to the game.
Besides this Xcode memory gauge, you can find memory footprint in many places on the system, including the Activity Monitor app on Mac.

And some Apple platforms use it for app memory limits.
Your game can also use this metric to guide its memory use.
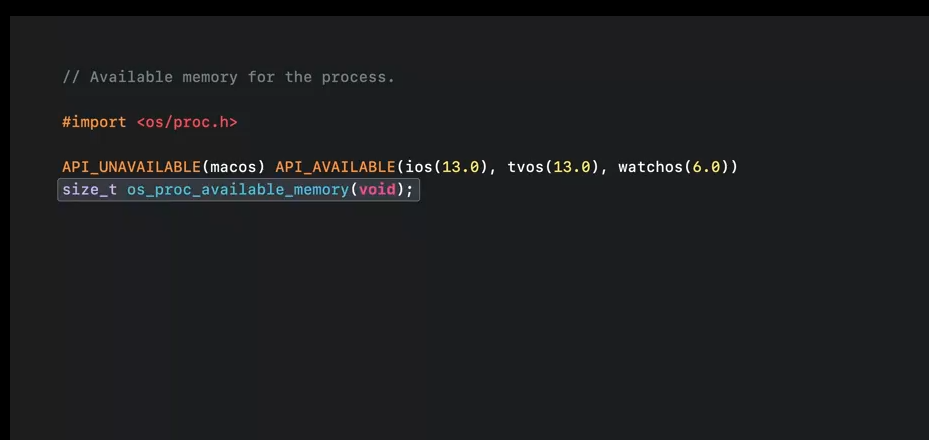
There are useful APIs to query current footprint and available memory.
Here's a quick look.
To get available system memory for your iOS, iPadOS or tvOS game, call os_proc_available_memory, which is in os/proc.h header file.
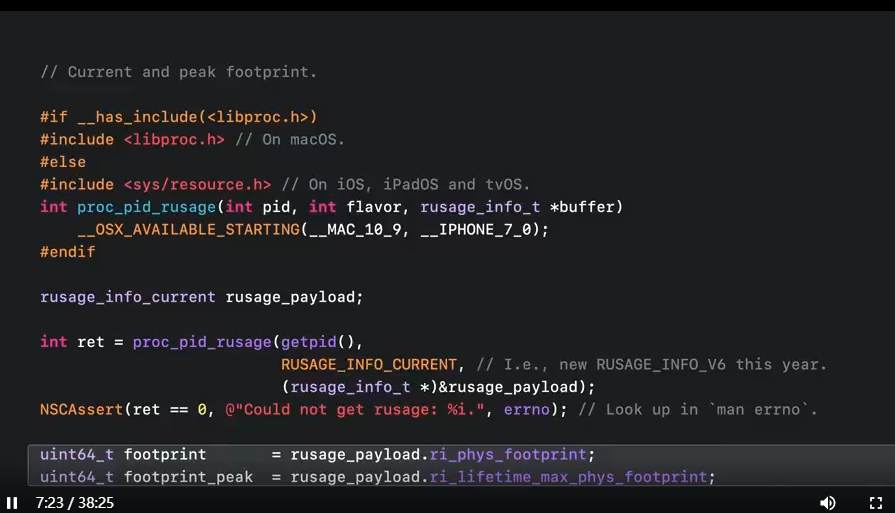
And for memory footprint on any Apple platform, you can get it via proc_pid_rusage, with process ID from "get pid", "rusage_info_current", which is version 6 at the moment, and the data store.
And retrieve its physical footprint or lifetime max physical footprint property.
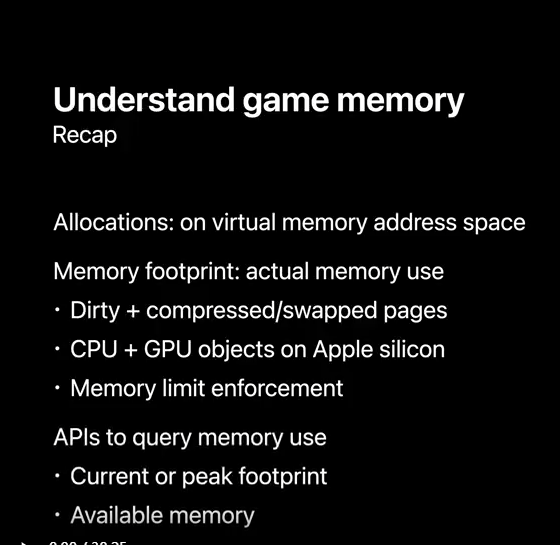
To recap, in this first section, we reviewed some concepts about memory.
Allocations in your game happen on virtual memory address space, and they will take up physical memory space as 16 kibibyte pages, once they're accessed by your game.
Memory footprint is the primary and universal metric on Apple platforms to determine your game's actual memory use.
Memory footprint contains dirty, compressed, and swapped pages.
It includes both CPU and GPU objects on Apple silicon.
And it's used for memory limit enforcement.
Your game can call system APIs to get its footprint, and available memory.
Now that you know how memory works behind the scenes, let's find out how it looks in your game.
Now, let's get started with capturing the memory growth for a game.
And I'll continue to use the Modern Renderer sample project.
When you run a game from Xcode, the Memory Gauge shows you the memory footprint over time.
However, you can get a much more detailed look at the memory use by profiling the game in Instruments.
Because oftentimes a game could allocate a lot of memory at launch time, you may want to begin profiling from a new game launch instead of attaching to an existing run.
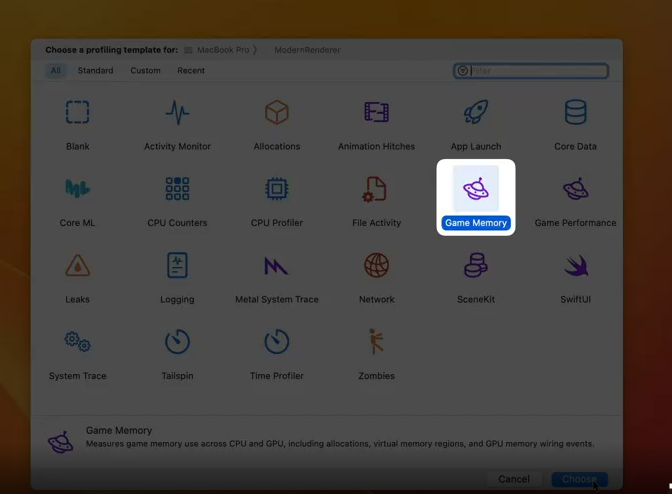
From Xcode, to quickly begin profiling your game, press and hold the run button, then choose "Profile".
This will automatically bring you to Instruments.
The Instruments app includes a collection of profiling tools that record different aspects of the system and visualizes the recorded data on a timeline.
New this year is the Game Memory template that can help you better understand the memory growth in your Metal game.
This template comes with the Allocations and Metal Resource Events instruments to record memory allocations with history, VM Tracker to record memory footprint, Virtual Memory Trace to record virtual memory activity, and Metal Application and GPU to record Metal-related events.
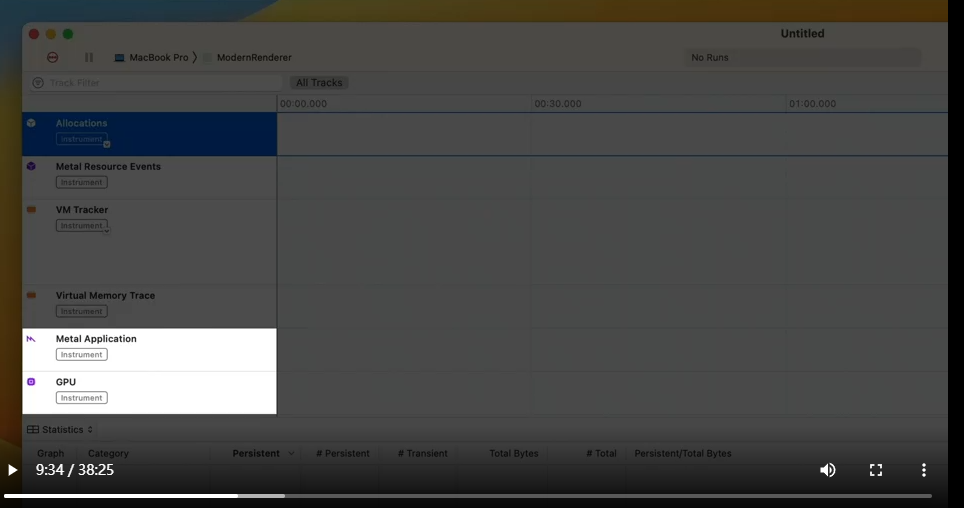
And in this demo, I'll highlight the first three instruments: Allocations, Metal Resource Events, and VM Tracker.
But first, let's record a trace for the game.
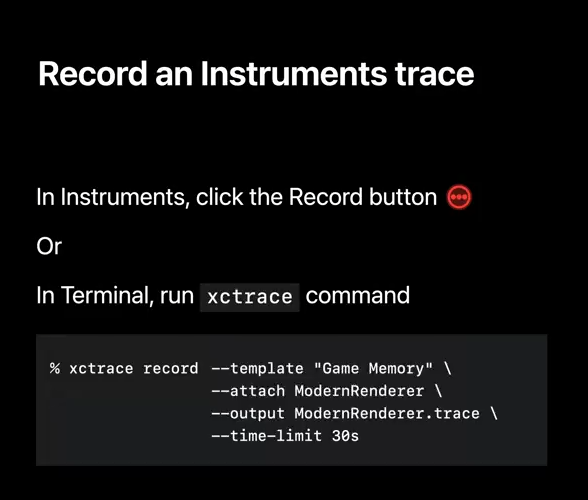
You can press the record button here to start recording.
And later, to stop recording, you can press the same button or simply quit the game.
While Instruments is recording the Modern Renderer, let me show you an alternative way to record a trace.
The xctrace command allows you to programmatically perform recordings, which may be useful in automation workflows.
Additionally, you can specify the device name to choose an iPhone, iPad, or Apple TV as the target.
Now that I have captured an Instruments trace, let's first take a look at Allocations.
The Allocations instrument gives you a detailed view of memory allocations, their sizes, and object reference counts.
However, it doesn't include private Metal resources.
The Statistics view displays all heap allocations and anonymous VM.
The All Heap Allocations include malloc'ed buffers which may contain objects, and All Anonymous VM includes interesting VM regions that may be dirty.
And we'll see in a moment that some Metal resources belong to this category.

Now, let's take a look inside All Heap Allocations.
Usually, the larger allocations are more interesting for optimization.
To find the single largest allocation, you can click on the Size table column to sort the allocations by size.
For an allocation, you can click on this arrow to see the reference count changes for Swift and Objective-C objects.
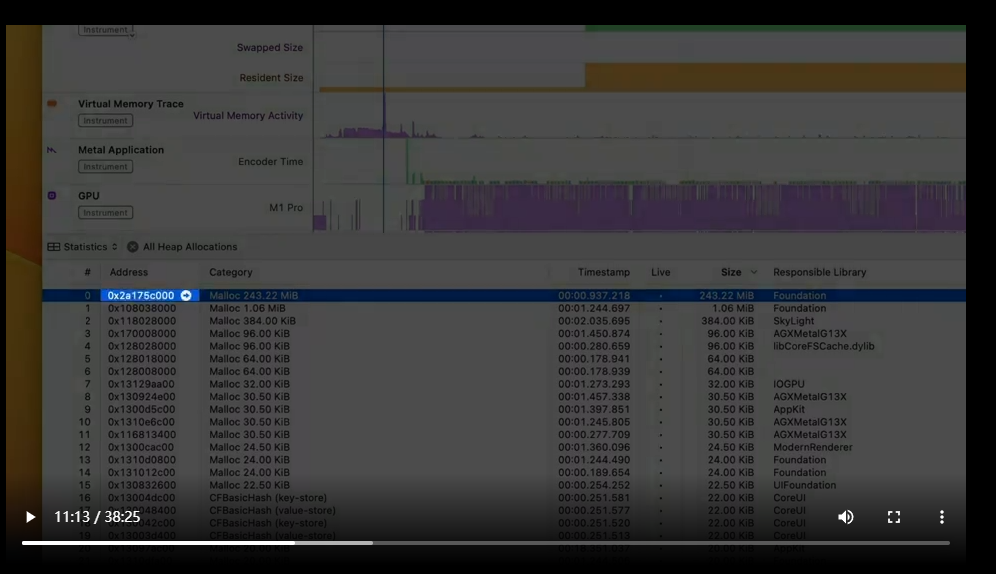
And with this large allocation selected in the list, there is the stack trace of the allocation history in the inspector.
Clicking on the button allows hiding the system libraries or frameworks.
And here, according to the stack trace, the allocation happened when Modern Renderer loaded the assets.
Double clicking on the frame can also bring you to the source code.

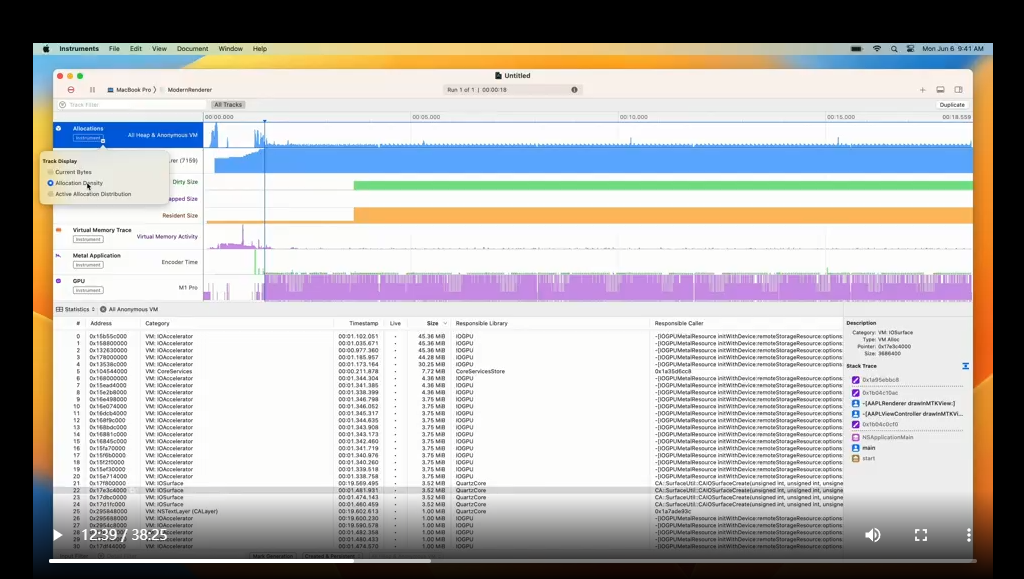
Now, let's go back and take a look inside the "All Anonymous VM" category.
In Metal games, you may find a lot of allocations in the IOAccelerator and IOSurface categories.
Allocations in IOAccelerator correspond to Metal resources.
From the stack trace, you can see this allocation happened while loading assets.
Allocations in IOSurface correspond to drawables.
And here, the stack trace shows the MetalKit view requested the drawable.
The Allocations instrument, by default, visualizes the allocation size.
However, it also comes with alternative looks.
You can on the arrow button in the Allocations track to customize the display mode to visualize Allocation Density.
This will update the graph to show you the amount of allocations performed over time and reveal spikes for memory allocations.
These spikes may be sources of memory growth.
So the data shown in Allocations is quite low-level.
To get a better understanding of the allocated Metal resources, let's move on to Metal Resource Events.
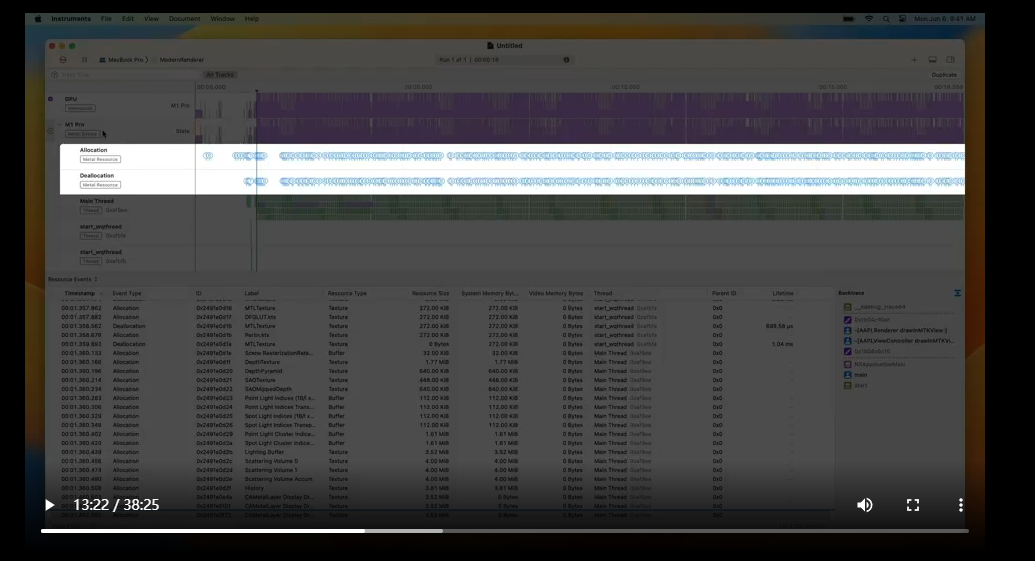
The Metal Resource Events instrument is designed around Metal resources.
In the Resource Events view, you can find a history of Metal resource allocations and deallocations.
Here, you could also identify the Metal resources by their labels which you can specify programmatically through the Metal API.
And similar to the Allocations instrument, you can find a stack trace for the allocation history in the inspector.
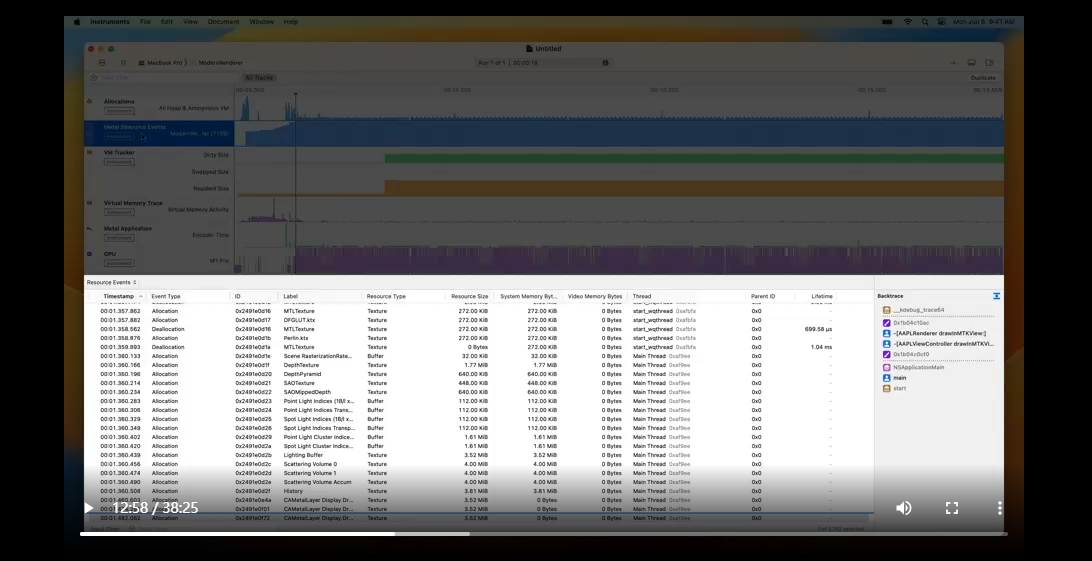
This instrument also adds the Allocation and the Deallocations track under the Metal device.
They help visualize the density of events.
So far, Allocations and Metal Resource Events can help understand memory allocations.
However, allocations don't always translate to memory footprint.
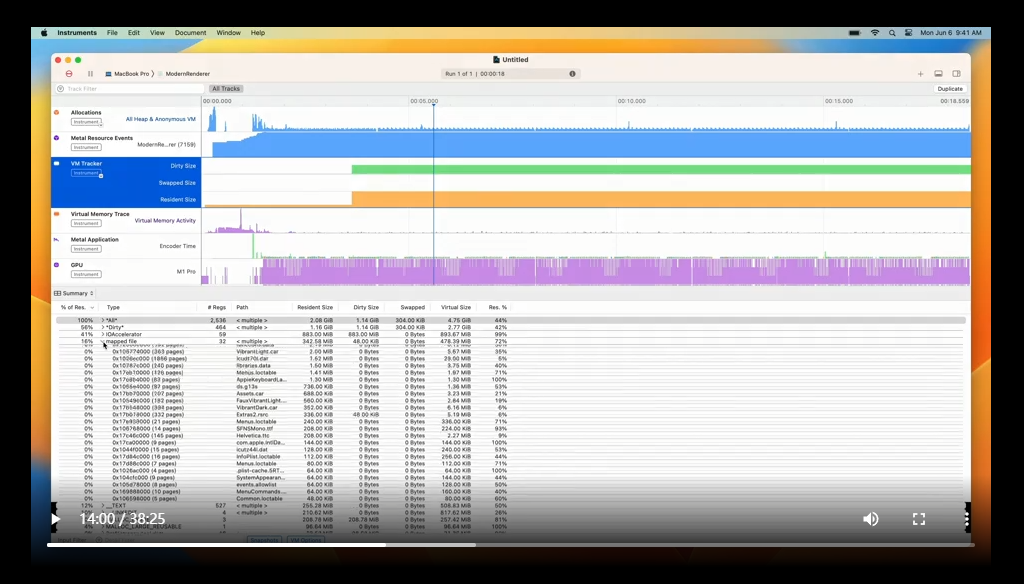
So let's move on to VM Tracker to investigate the actual memory use.
The VM Tracker instrument shows the non-compressed dirty and compressed or swapped memory.
The Dirty Size represents the non-compressed dirty memory.
And the Swapped Size represents the compressed or swapped memory.
In this recording, there's no compressed or swapped memory use from the Modern Renderer.
The detailed Summary view shows the VM regions.
And in the "mapped file" region, you may find some memory-mapped resources like your game assets.
Here, Modern Renderer maps the bistro asset file into memory.
So that's a brief overview of the Allocations, Metal Resource Events and VM Tracker in Instruments.
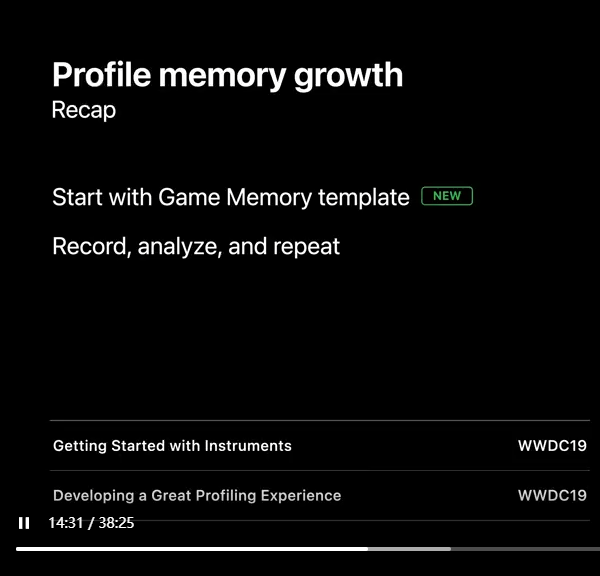
To quickly recap how you can profile memory growth: First, choose the Game Memory template, and then, record and analyze the trace.
Sometimes, you may repeat this process a few times when reproducing or verifying memory growth patterns.
We hope the new Game Memory template can help you better understand the memory allocation or footprint growth in your game.
And please check out these other videos to learn more about using Instruments.
The game Memory template looks really cool, and it's going to be so useful to help with understanding changes of memory use over time.
In addition, you might also want to capture the memory state of the game at a given time, so you can dig deeper into that memory state and examine it through different lenses.
And for that, we have memory graphs and a suite of tools.
Memory graph is a file to efficiently store a complete snapshot of your game's memory state, including object creation history, references, and any compression or swapping.
You can take a snapshot anytime you want, such as when an issue occurs, or a pair of those, before and after an issue happened for comparison.

To spice things up, let's use a cookbook analogy on how to analyze memory with memory graphs.
It includes an ingredient and a preparation part.
For the Ingredients, well, you would need your game; something called Malloc Stack Logging; and, a captured memory graph.

It's quick to configure Malloc Stack Logging and to capture a memory graph.
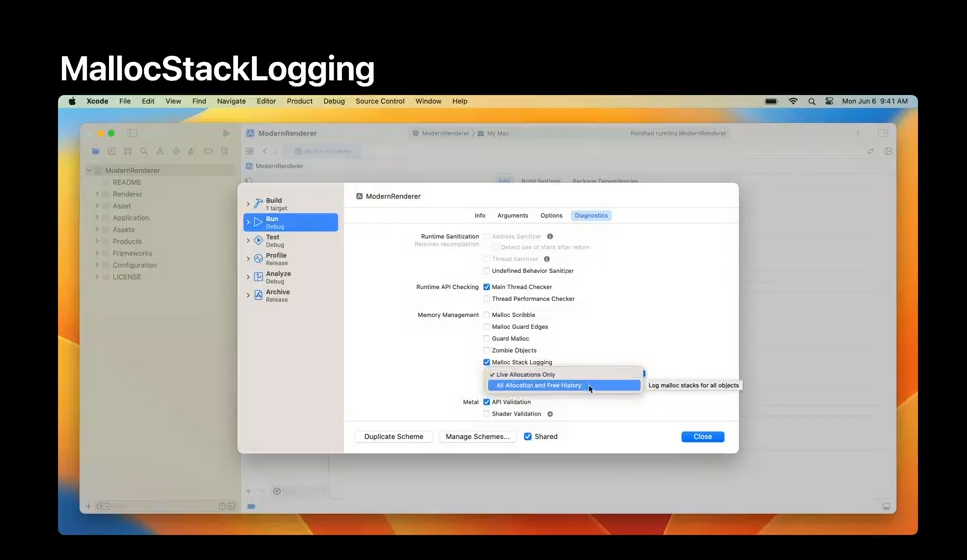
Malloc Stack Logging records allocation information in the game process.
You can find it in Scheme settings.
Choose the Run action, go to Diagnostics, and tick the Malloc Stack Logging checkbox.
In case you wonder what the two options are; All Allocation and Free History keeps track of all objects even after they are deallocated.
The logging data may take up more memory, but it's useful for debugging issues such as fragmentation.
On the other hand, Live Allocation Only discards deallocated objects from its history, so it's lighter.
In this case, I'm only investigating references, which are on live objects, so I can pick this option.
In fact, most of the time, Live Allocation Only will be your recommended option.
Alternatively, you can set environment variable if not launching from Xcode.
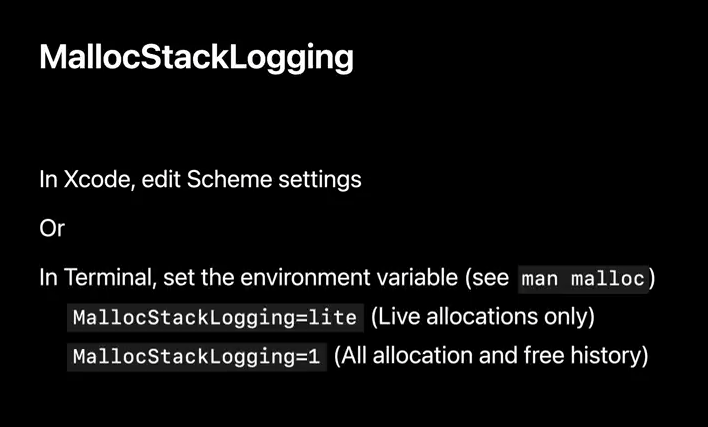
Check out the malloc manual page for some additional recording modes.
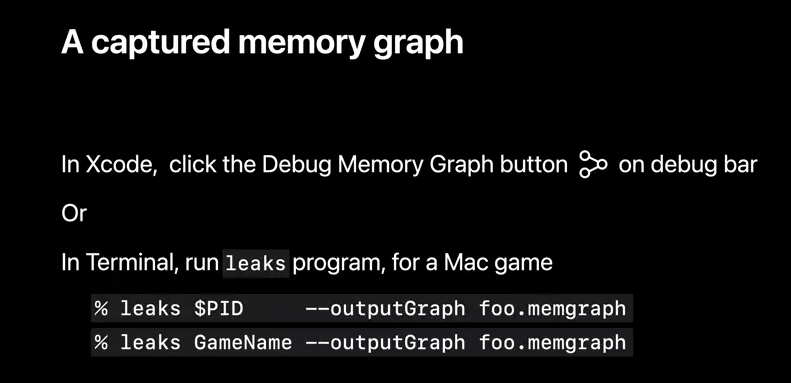
After that, also prepare a memory graph.
Just click on the debug memory graph button in the debug area.
Xcode will take a memory snapshot, process it, and enter the memory debugger.
Xcode Memory Debugger provides intuitive perspectives into the game's memory use.
Let's take a minute to explore the view.
On the left side, Debug Navigator gives you a hierarchical list of object instances.
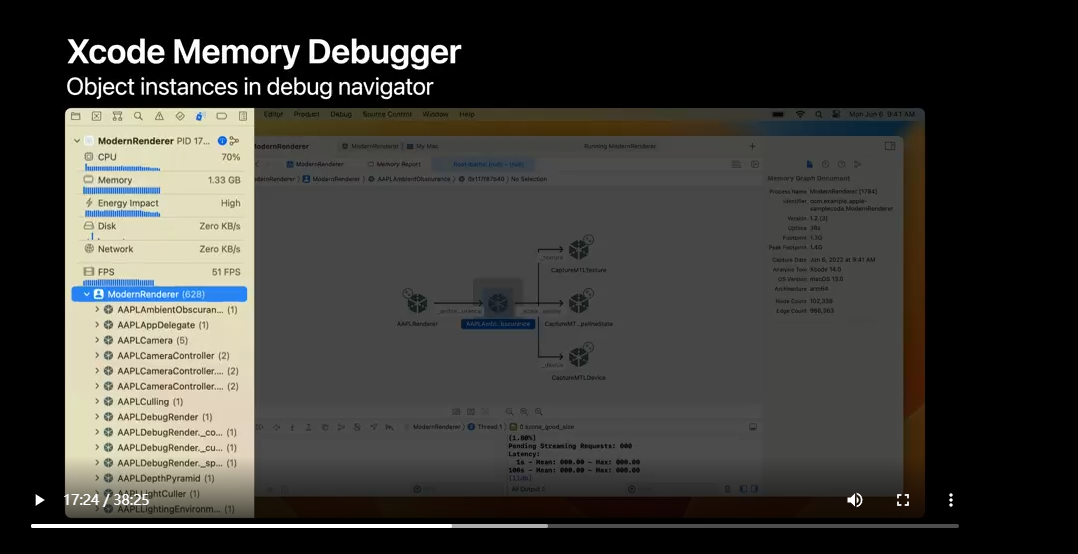
On the right, File Inspector provides useful information such as memory footprint, uptime, and capture date.
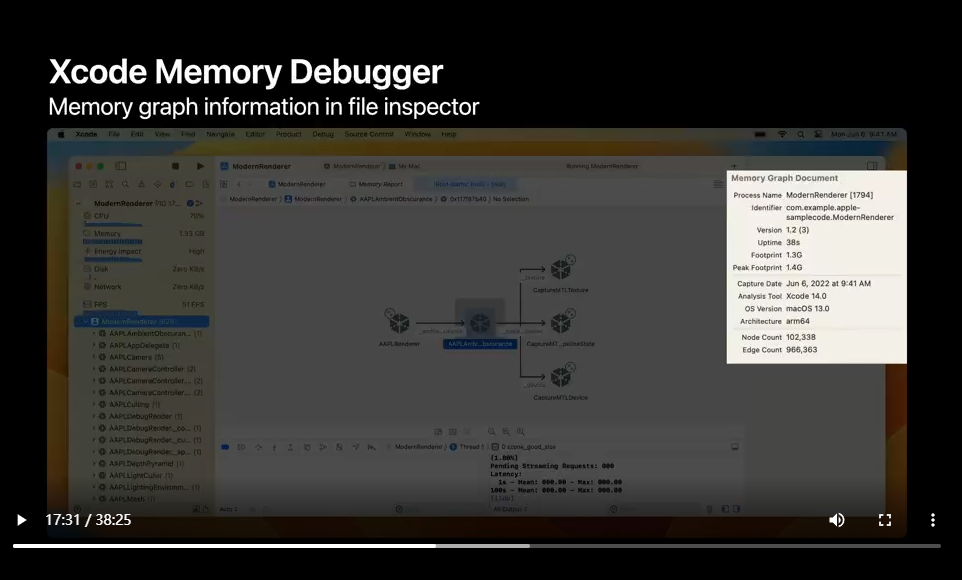
In the middle area shines the memory graph view where you have the selected object from the left, and how references connect to this object.
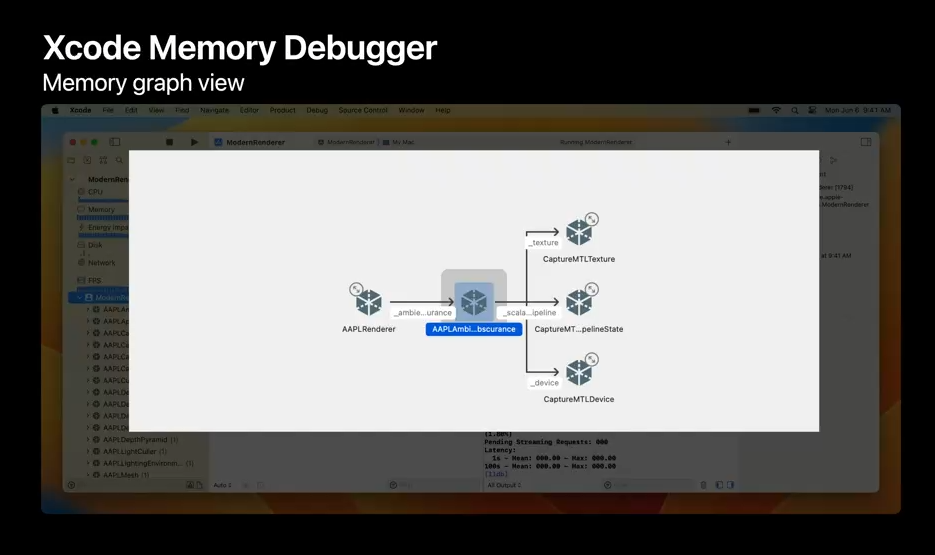
I'll come back to this graph in a bit.
And the File menu gives you the option to save this memory graph for future analysis, or to easily share with your team.
For a Mac game, you can also capture a memory graph with the leaks command line program, using process ID or name.
This means you could do it remotely in a secure shell, so the cursor stays in the game, in case your game is running fullscreen and needs to stay in focus.
So that's what you'll need to start memory graph analysis.
Now it's time to examine this memory graph using Xcode Memory Debugger, plus some versatile command line tools in Terminal, to find out allocations, footprint, and even more.
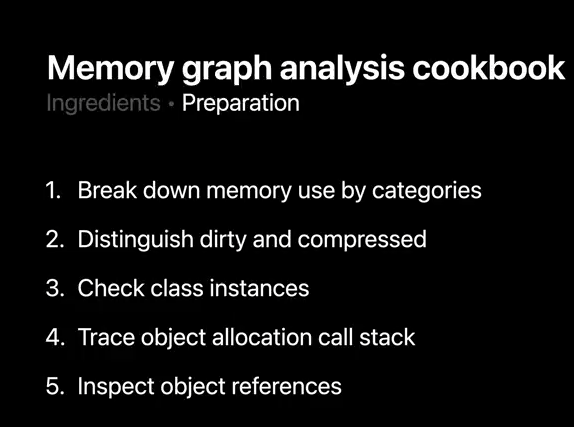
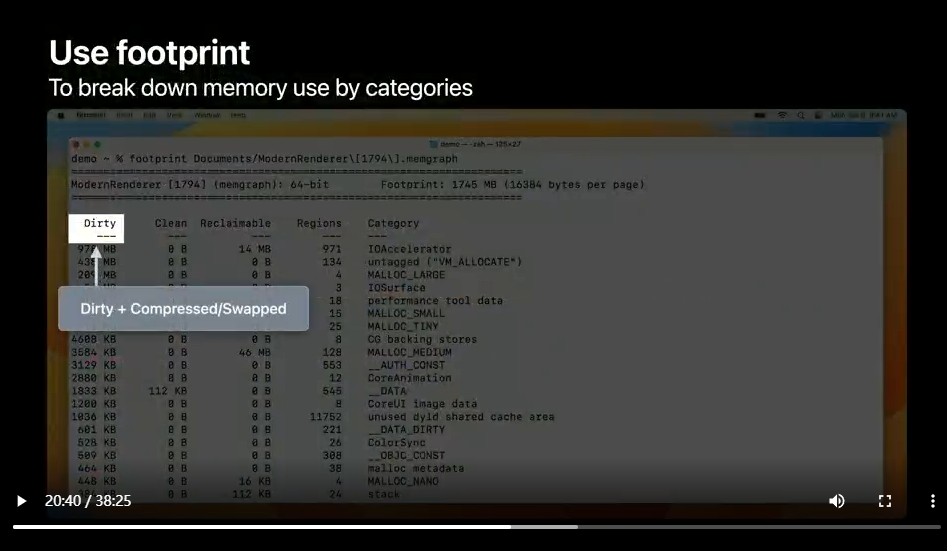
A good first step is to break down memory use by categories.
The footprint program does just that.
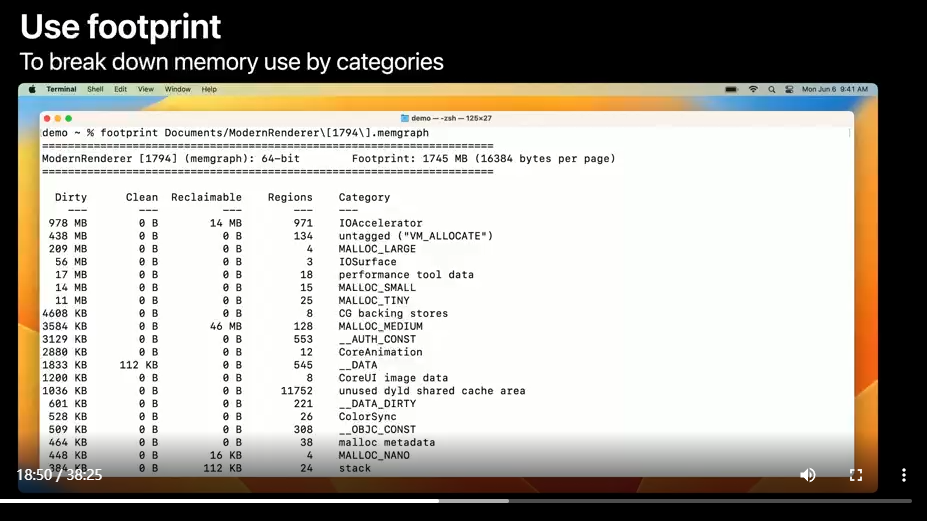
Footprint uses information in the memory graph to recreate this high level summary.
Typically, you will want to first focus on the larger categories.
For game memory graphs such as this one from the Modern Rendering sample code, IOAccelerator is usually the largest one.
As Seth said, it includes Metal resources.
Here, heap allocations go to several MALLOC_(prefixed) categories, since the system groups heap allocations to size pools to improve performance.
These objects may come from many places, such as third-party plugins, or libraries, where your game does sound effects or physics simulation.
Here's a memory graph from an awesome Apple Arcade game, Manifold Garden, created by William "Cheer" Studio.
I'm glad they allow me to show you the game's memory usage.
If your game uses a game engine, like Manifold Garden using Unity, or a custom allocator on top of memory map, that memory would be shown as untagged VM_ALLOCATE like this.
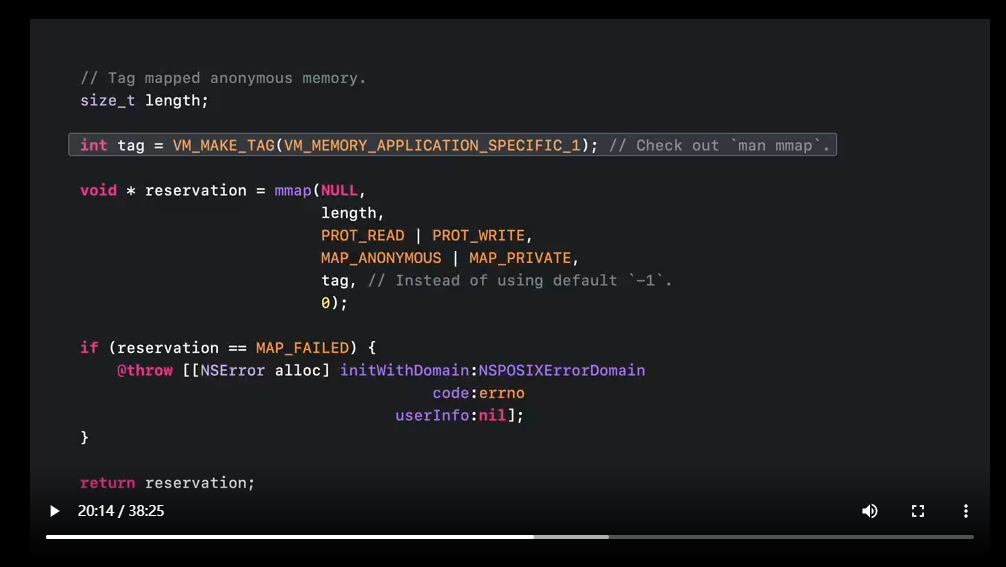
Here's a pro tip: on Apple platforms, your game can use up to 16 app-specific tags, so you can have more clarity when drilling down memory usage.
It's as easy as a one line change.
First, make the tag from one of 16 options.
Then replace the minus one with this new tag as the "file descriptor", when calling "em map".
Check out "em map's" manual page to learn how tags and categories are defined.
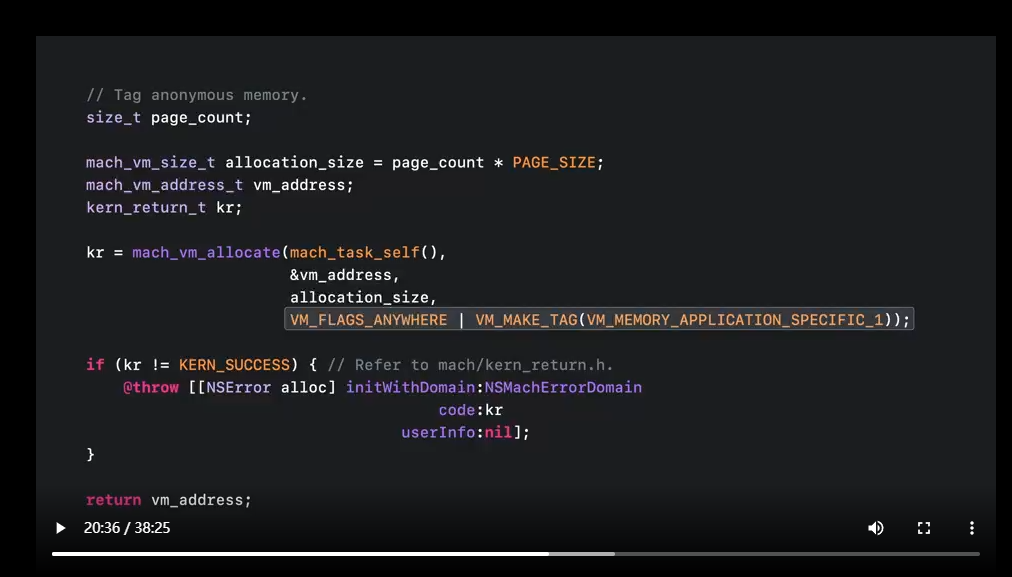
If you use "mach VM allocate", include the same flag in the flag argument when allocating.
In the world of footprint program, the dirty size also includes swap and compressed, so think of it as total charged for each category.
That's a brief idea of the composition of current memory use, and how it makes up the footprint.
Some of this memory is less used and become compressed or swapped.
They might be sources of memory savings.
The next step is to find out how much compressed or swapped memory the game uses, and optimize.
For this, you can run the memory graph with vmmap.
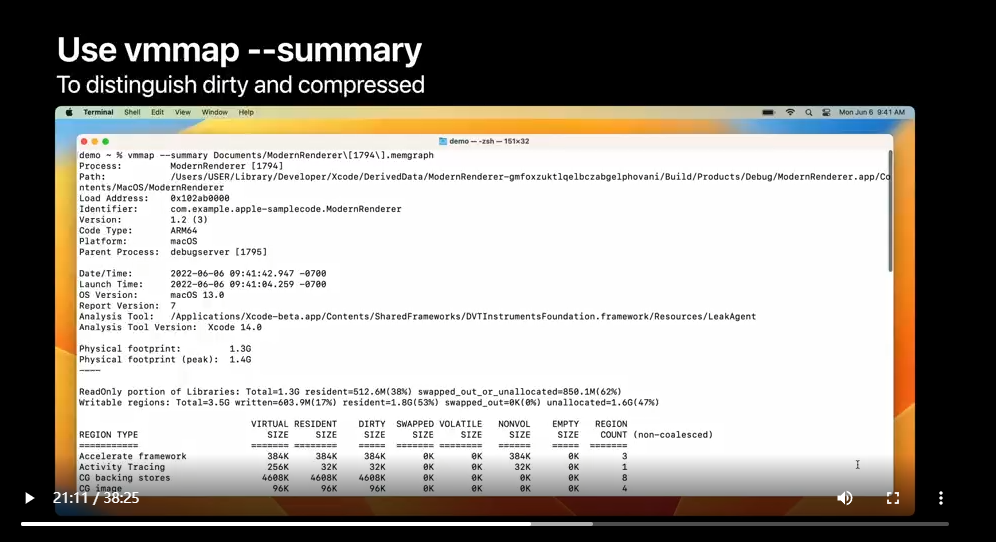
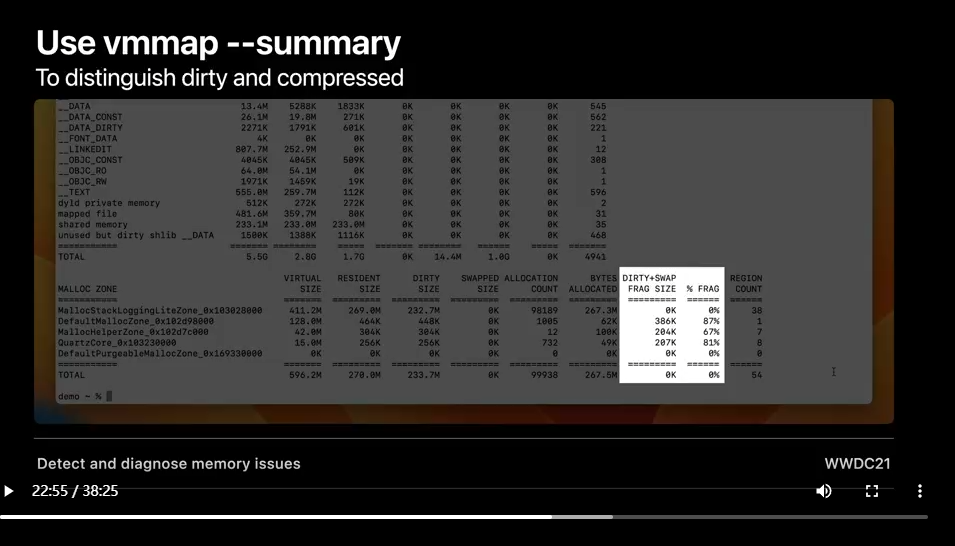
It gives you dirty and swapped sizes, instead of two combined.
This dirty column includes currently not swapped or compressed regular dirty memory, while the swapped column includes the original size of compressed or swapped memory.
The system adds these two columns together to determine footprint.
But since content in the swapped size column isn't used as often, it is a good indicator for what to look for to optimize your game's memory.
Oh, by the way, here is the allocation size, with the virtual size column.
And the resident size includes clean pages such as executables and memory mapped files.
Conveniently, vmmap shows heap allocations with a separate table.
At the bottom of its output, vmmap groups heap memory by zones.
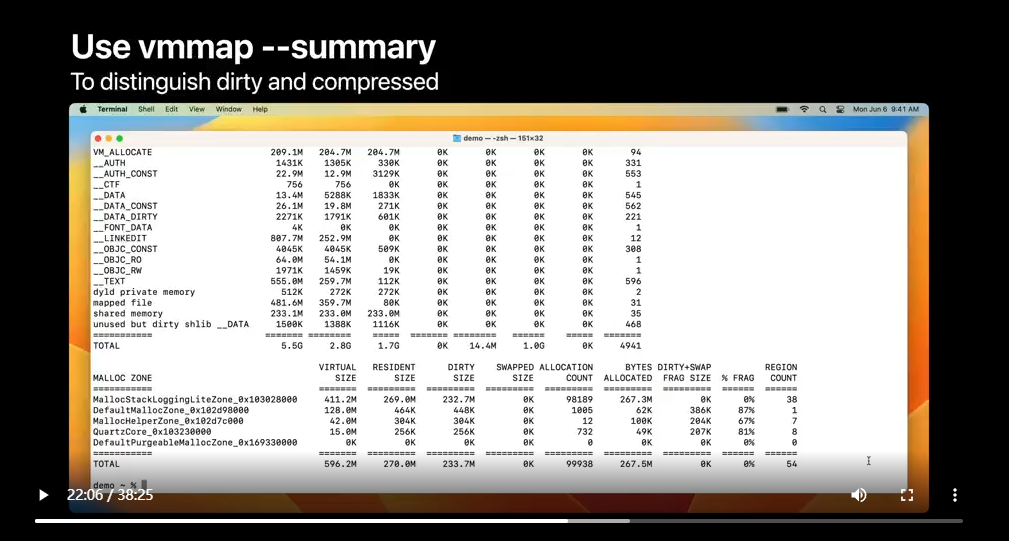
These zones reflect their usage or lifecycle in your game.
Because I turned on MallocStackLogging, allocations on the heap are in the tool's zone.
Otherwise, they would be in two default zones: MallocHelperZone and DefaultMallocZone, based on the allocation size.
And usually you could skip smaller system utility zones such as QuartzCore zone.
Also, if you suspect fragmentation, indicated by high fragmentation size or percentage, like dozens or hundreds of megabytes, the WWDC 2021 session covers more about fragmentation issues.
And running vmmap without dash dash summary, or to use vmmap in standard mode, shows each vm region within those categories line by line.
Just like how the virtual address space looks like, as we discussed earlier.
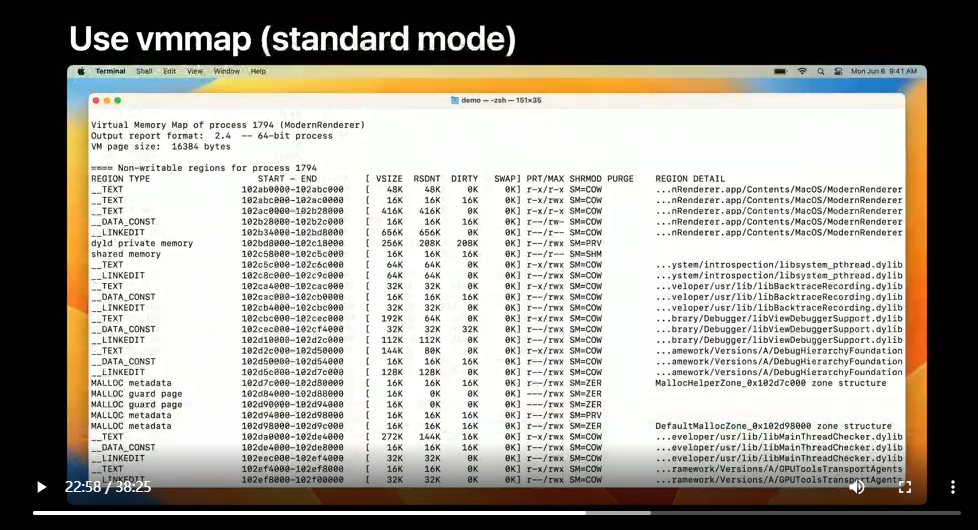
So with vmmap, you can distill less used dirty memory from actively used ones.
And typically, there are also a good amount of dynamic allocations of various sizes, or malloc'd heap memory usage in the game.
They need a special look.
Heap tool groups malloc'd resources by their classes, and sorts them by instance count.
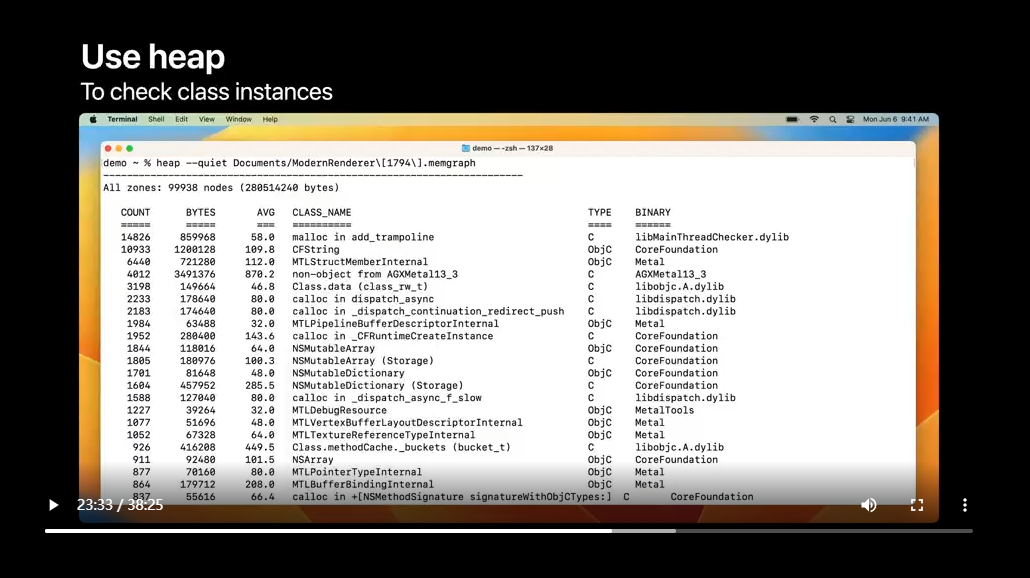
These classes are determined in C++ with a VTable, Objective-C, or Swift.
We are using the —quiet argument to skip the header about some metadata.
New this year, heap is more intelligent at identifying object types.
It uses information recorded by Malloc Stack Logging to present the caller or responsible library, so a huge non-object is a thing of the past.
And here is the memory graph from Manifold Garden again.
In this example, it is revealed for the first time how much heap usage is taken up by plugins like FMOD Studio, and game components such as GameAssembly.dylib.
So now you can be more informed on how the memory is spread out.
And it also hints which direction to go for getting more info on these objects.
In this example, the developer can open FMOD Studio to fine tune the soundtrack and sound effects in the game, or go to Unity to look for game code optimizations, and so on.
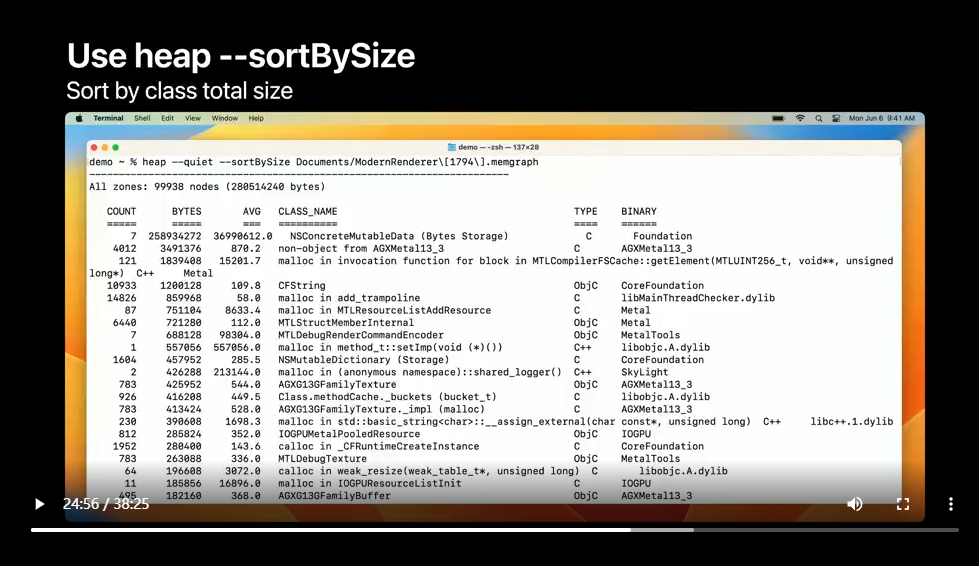
Sometimes, sorting by class total size rather than class instance count is more helpful.
In the memory graph of the Modern Rendering sample project, the top contributor is a class using over 258 million bytes.
To continue looking for larger objects in the Modern Rendering sample, use heap to sort objects by class total size with —sortBySize, and list all objects with —showSizes, rather than a summary of each class.
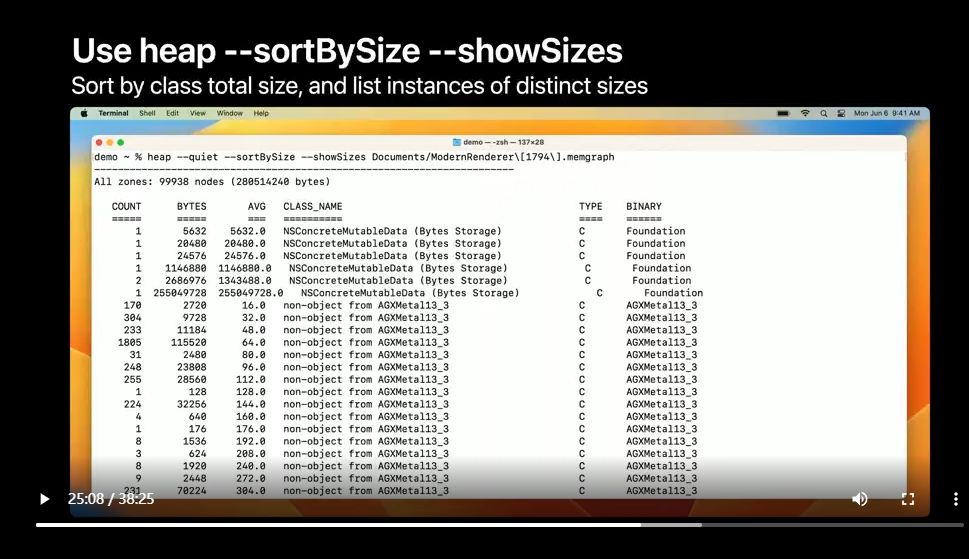
And, there is one object of NSConcreteMutableData in Bytes Storage with a size of 255 million bytes: that looks like one worth looking at.
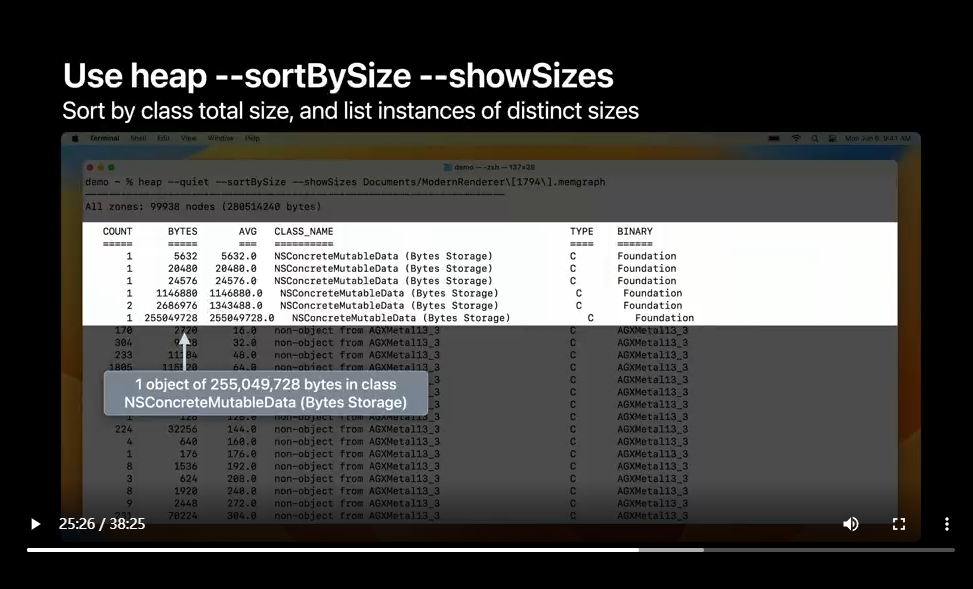
Next, I want to find out what it is.
And I want to know its address for a start.
I add —address and enter the pattern NSConcreteMutableData followed by wildcard– dot star, and a size filter in the bracket to only list objects 10 megabytes large and upwards.
And here is the address of the object.
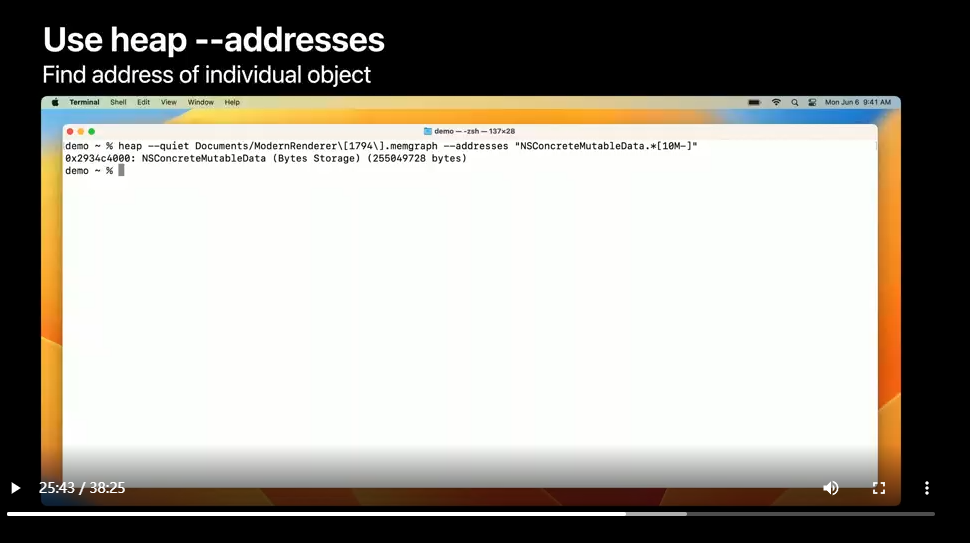
I'll use it in the following steps for more in-depth analysis.
So that's heap tool, with improved object identification for instances.
So far, you've seen three tools to understand what objects are using memory in the game, and they all provide different views.
What I showed was just one workflow.
Depending on the particular memory patterns, or technologies used in your game, you can use them in any way that suits your needs.
With discoveries for objects that we are not quite sure of their existence, the next step is to get its origin, which is its allocation call stack.
In the case of the 200 million bytes object in Modern Rendering, I use the —callTree mode and pass in its address to malloc_history.
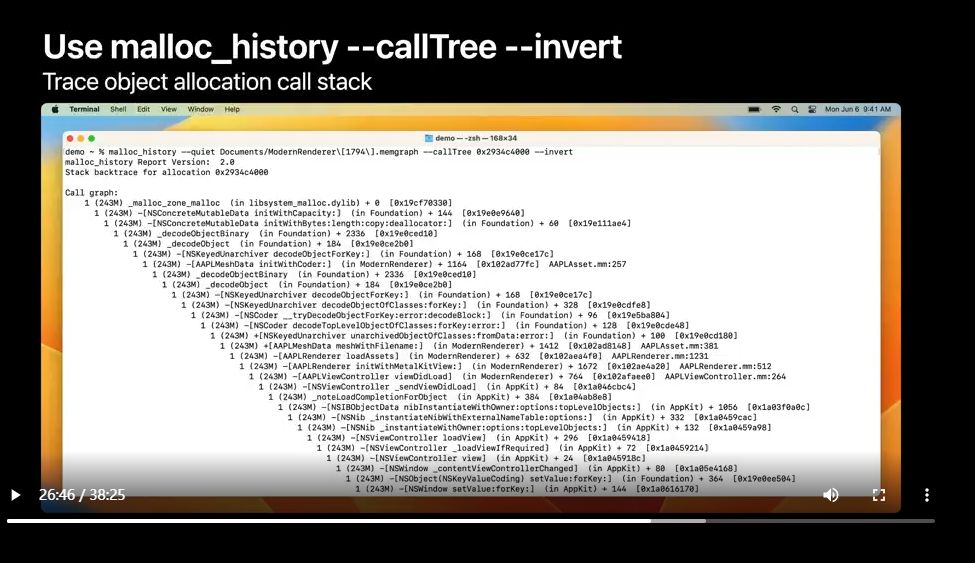
Together with additional invert argument, I can focus on functions closest to the allocation.
And voila.
Here is the back trace of the allocation.
Similarly, Xcode Memory Debugger shows the allocation history of an object too in the inspector.
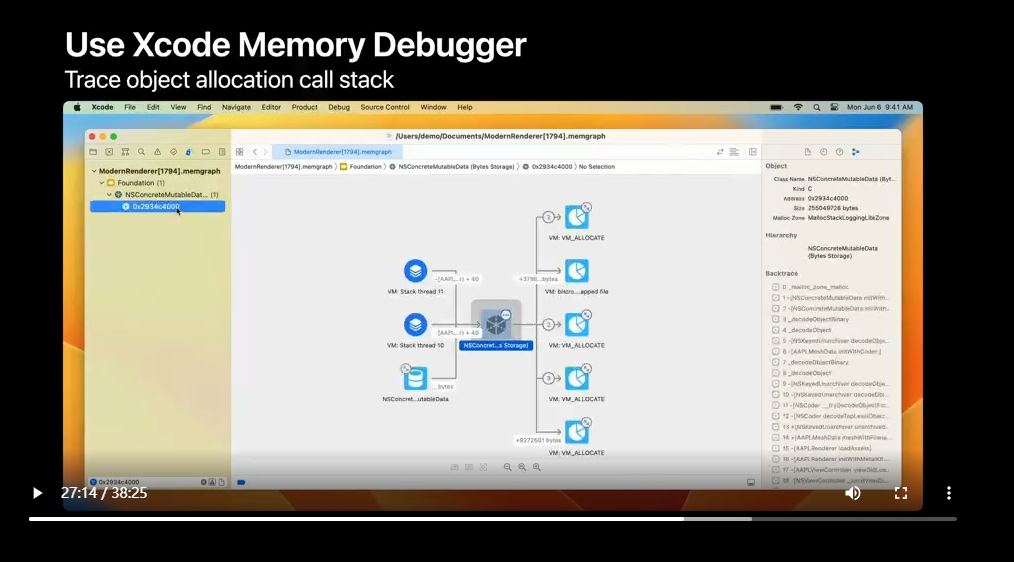
Just select an object, click on the Memory Inspector, and there it is.
As another example, pass in VM_ALLOCATE as the class pattern instead of an address, to check for anonymous VM usage in your game or plugin, such as debugging a custom allocator.
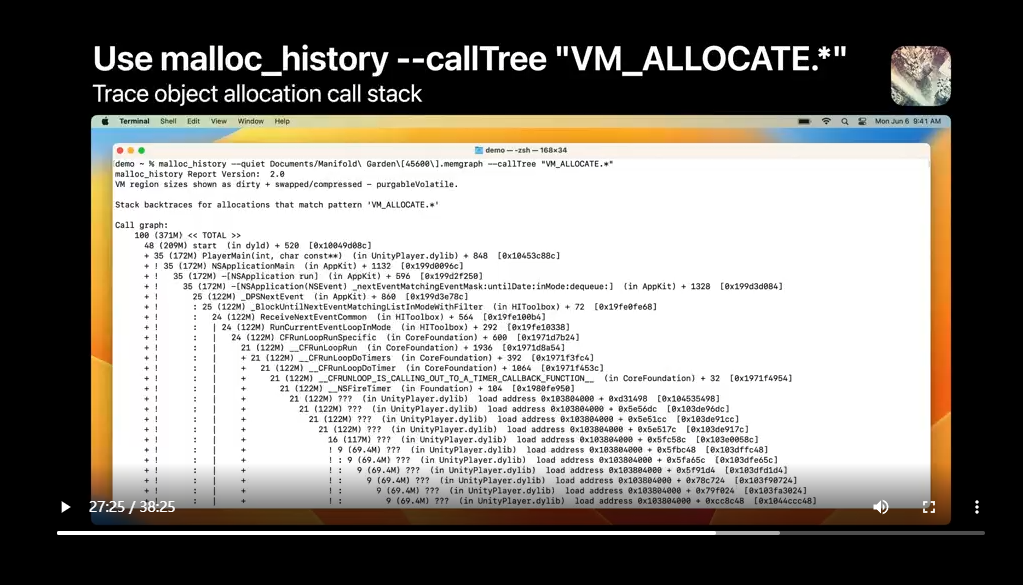
Whether using Xcode or malloc_history, you can know the allocation back trace, and decide if you want to dig deeper, including setting a breakpoint at the line, for a start.
And last but not least, it's also helpful to investigate object references.
Memory graph always records object references, even when MallocStackLogging is not enabled for various reasons.
We've used leaks before to capture a memory graph outside of Xcode.
Leaks does more.
It checks for all references in the memory graph, and that is why it knows about leaks and retain cycles.
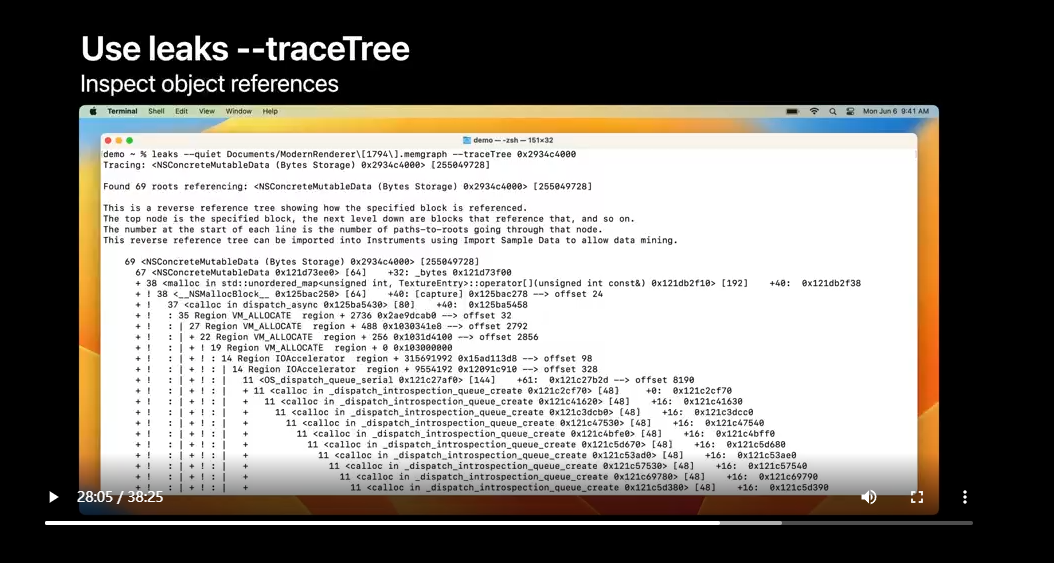
Leaks gets this tree of references to the object by using the trace tree argument and the object address from heap.
However, because this is a rather large tree in this example, there is a somewhat better way to view it than in Terminal.
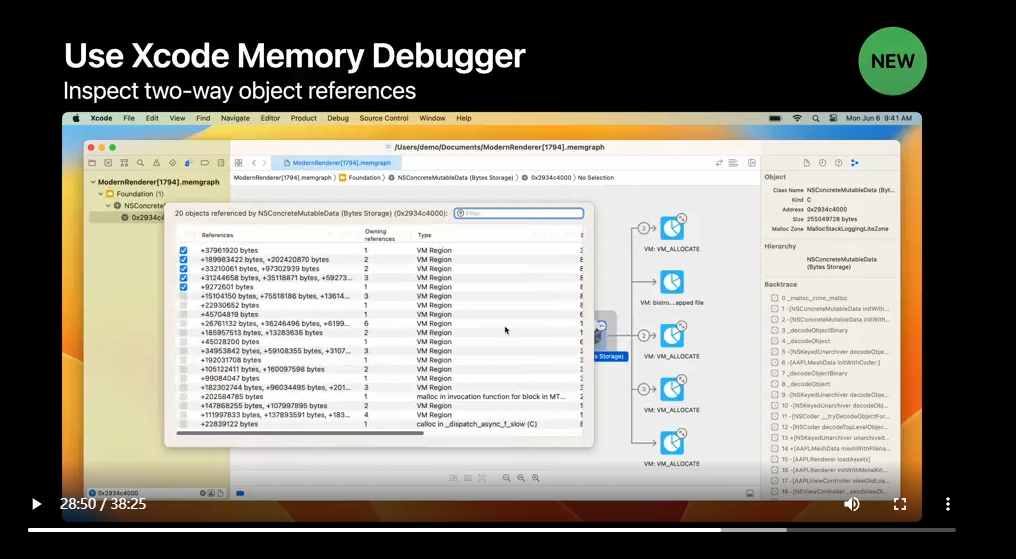
With Xcode 14, we redesigned the memory graph view to show both ingoing and outgoing edges of the selected object.
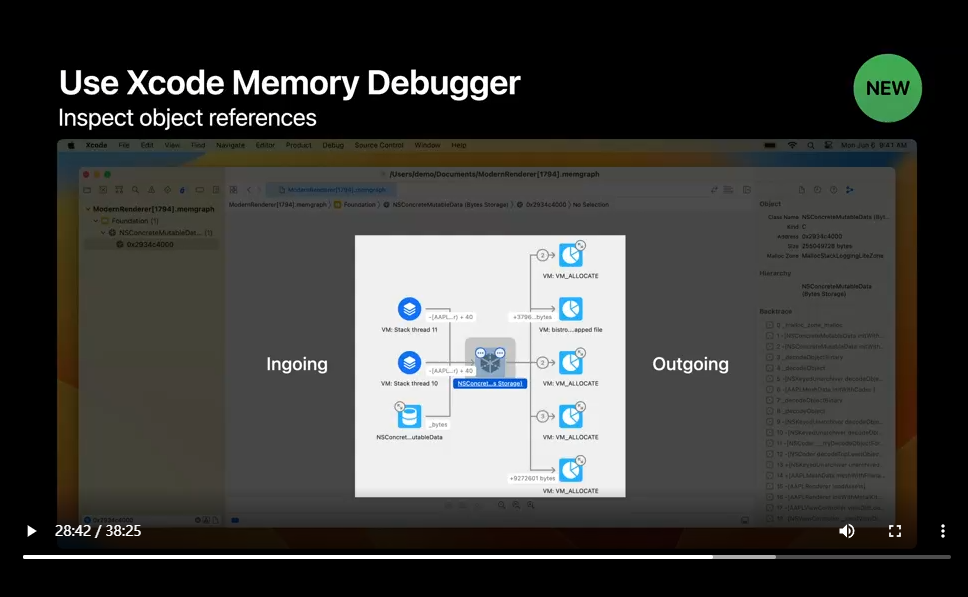
It even has a new neighbor selection popover, to choose the edges you want Xcode to draw.
This is going to greatly improve productivity when trying to understand object references in complex game states.
After exploring around for a little bit, I'm pretty sure the texture manager is what is accessing this object.
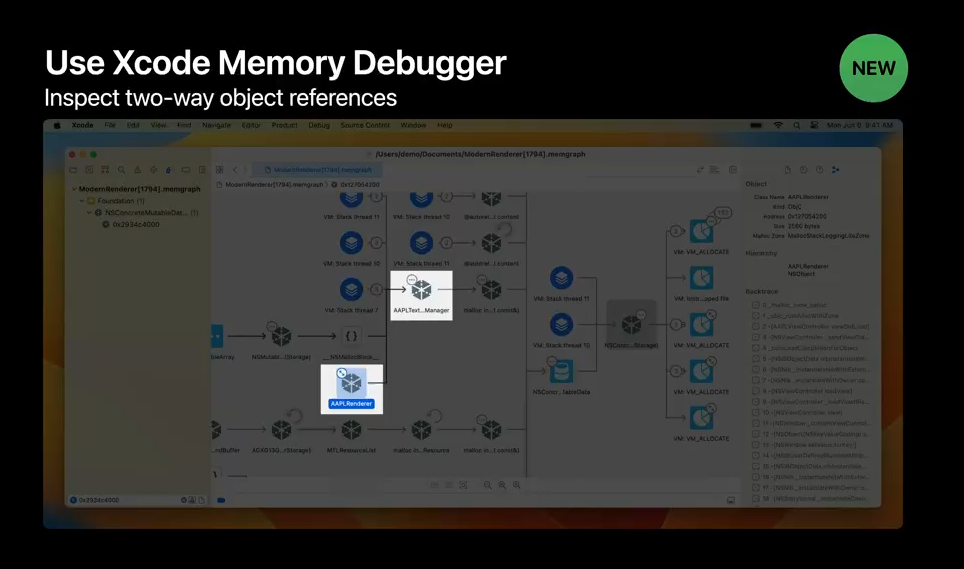
For your game, consider using leaks tool and the memory graph view to find important object reference relationships, to learn how these objects are accessed in the game.
So that how to view and find out important references of an object using leaks or Xcode.
Please check out leaks' manual page, and Xcode help for more usage of these tools.
In this memory graph analysis cookbook, each step uses some specific tools.
All of them work together to complete the analysis on a memory graph.
To summarize, the first thing is to enable MallocStackLogging when you expect to capture and analyze memory with a memory graph.
Then capture a memory graph with Xcode for your game, or alternatively use leaks tool for your Mac game.
Next, find large and troublesome objects.
Footprint, vmmap, and heap tools provide breakdown of memory, both on a high level and in details.
With malloc_history, you can find out where objects are allocated and leaks can analyze object usage or references.
These previous sessions include in-depth walkthroughs as well as demos of more usage of these tools.

Until now, we have deferred probing into Metal resources.
Hi again! In games, Metal resources can use a big chunk of memory.
But there are ways to optimize their memory use.
Here I've summarized a list of memory savings that you can use when optimizing the Metal resources in your game.
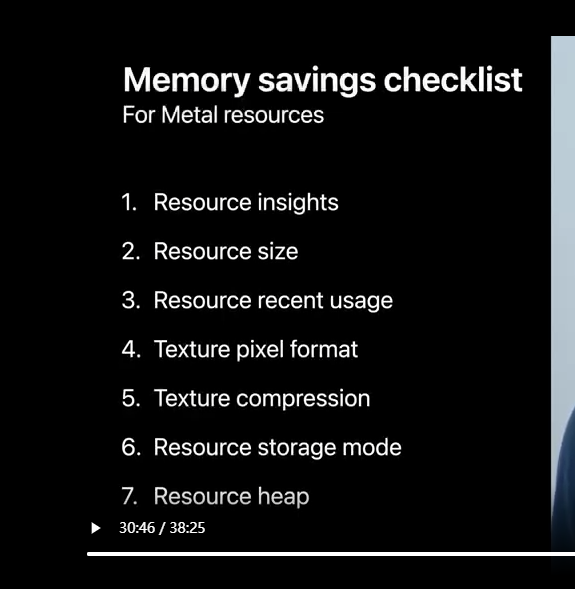
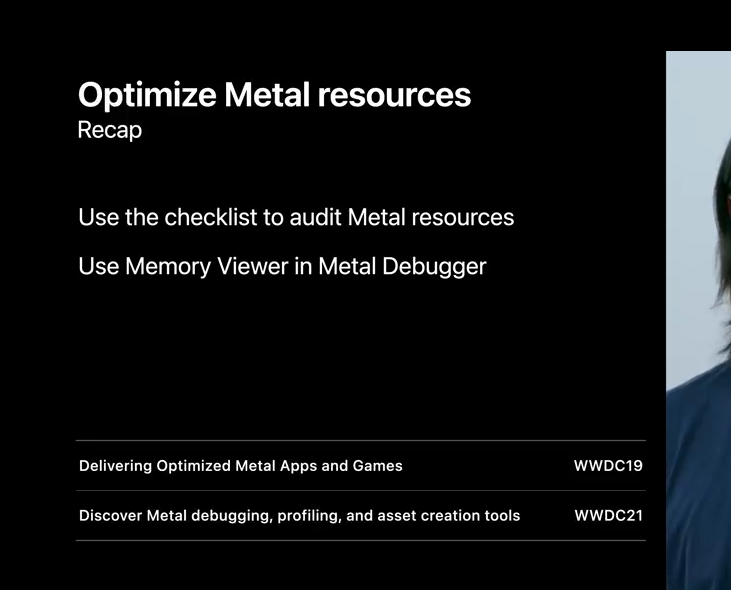
We'll take a look at how Metal Debugger can help you with auditing the resources and learn some advanced techniques for further reducing your game memory.
Metal Debugger is the one stop shop for debugging your Metal games.
After taking a GPU frame capture, you can find a summary page.
This provides you with some general stats about the captured workload.
In the lower half of the page, there is a list of insights divided in four categories.
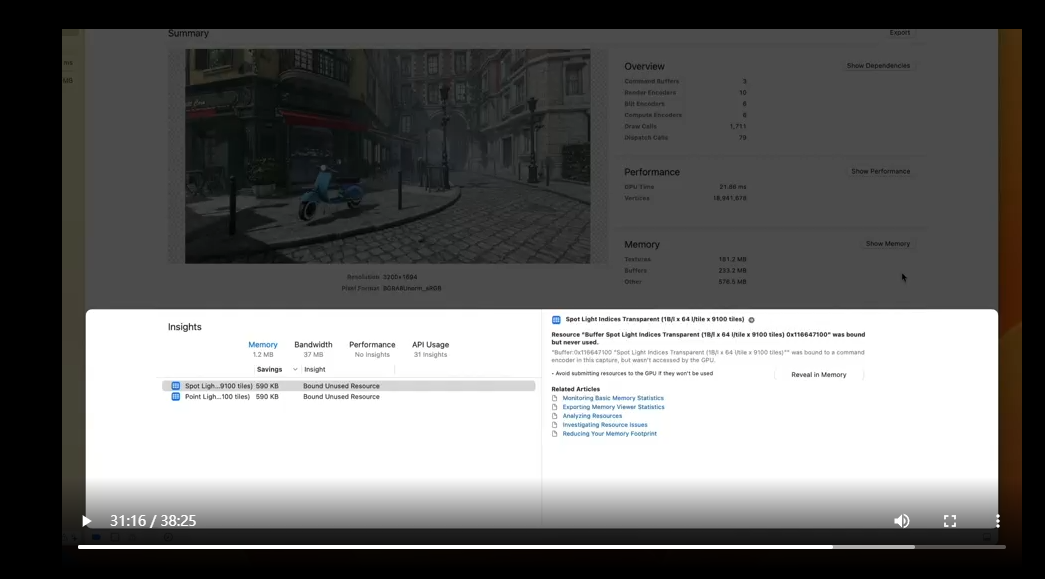
Insights in the "Memory" category suggest memory savings for your game.
There aren't many memory insights particular for this trace; we can save just a few megabytes of memory after addressing these insights.
However, there may be more memory savings specific to your game.
To get a more complete picture of the memory used by Metal resources, you can use the Memory Viewer from clicking on the Show Memory button.
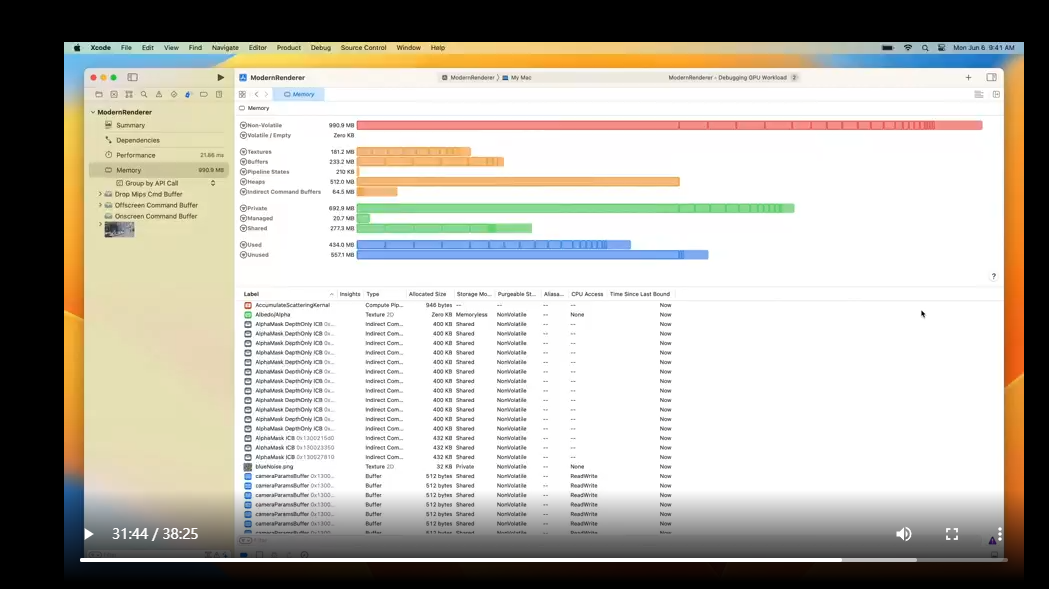
The Memory Viewer offers you a full list of resources captured from the game.
The upper half shows different categories for filtering.
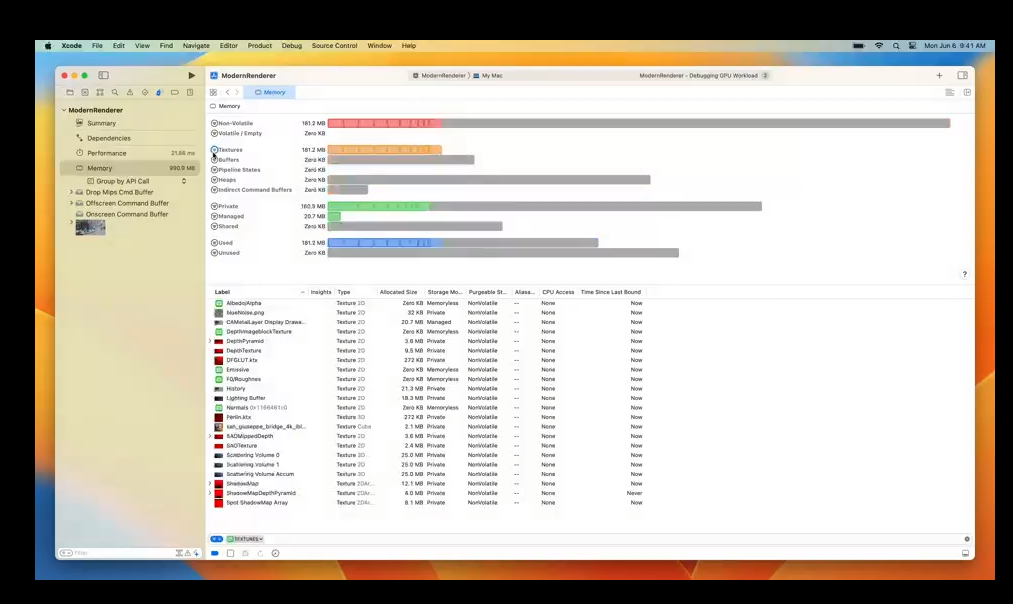
You can quickly use this to look up resources, say, textures.
And in the lower half, the table displays just the textures.
Let's take out the filter for now.
The resource table has a collection of columns to help you optimize your game.
And I'd like to highlight a few columns that may help you quickly identify some interesting resources.
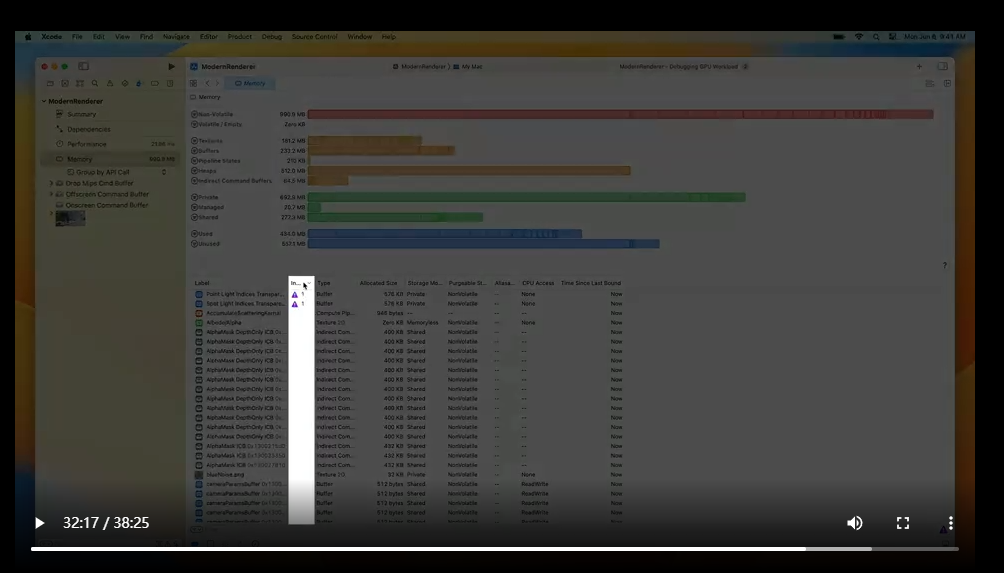
The Insights column is similar to what we just saw on the summary page.
You may quickly view all the resources with insights when sorting the table by this column.
And clicking on an insight icon will reveal a popover explaining the finding and providing some possible actions.
Right next to this column is Allocated Size.
You can sort by this column to see the largest resources.
It may be useful to audit if some resources actually make good use of their memory size.
For example, some textures may be resized to smaller resolutions and some models loaded in buffers may use a lower poly count, given that doing so won't affect the visual quality of the game.
There are some alternative ways to save texture memory that I'll mention in a minute.
Another interesting column here is Time Since Last Bound.
You can sort the resources by this column to find which haven't been used recently.
If a resource is never used, it may be a good idea to double check if it's worth loading the asset.
For a resource that hasn't been bound for a while, you may consider releasing it if it won't be used again in the future.
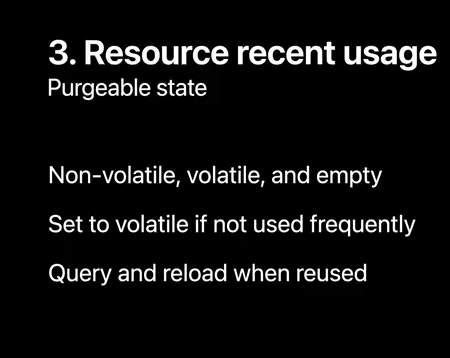
Alternatively, you can set its purgeable state to volatile.
A Metal resource may be in one of the three purgeable states: non-volatile, volatile, and empty.
By default, resources are non-volatile.
By setting the purgeable state to volatile, Metal may evict the resource from memory in case of high memory pressure in the system.
Once the resource is empty, the system will no longer charge it towards the game's footprint.
When your game needs the resource again, check if the content's still there, and reload if needed.
Consider only using volatile for infrequently used resources, so the purgeable state doesn't work against you.
So those are some of the general notes for all resources.
And now, let's take a closer look at textures.
Not all columns are shown by default in Memory Viewer.
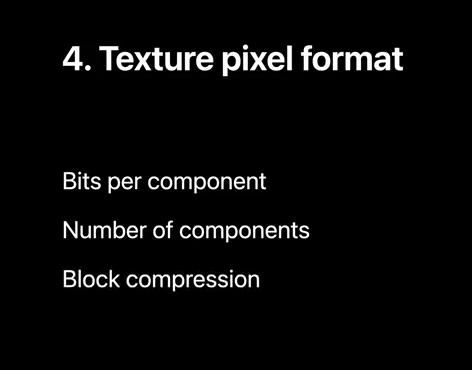
Right clicking on the table header will allow showing and hiding columns like texture's Pixel Format.
You may get different amount of savings by optimizing the pixel format for a texture.
Many textures in a game could use a 16-bit half precision pixel format to reduce memory use and bandwidth.
In cases when you need a texture with a single alpha component, you may avoid multiple color channels.
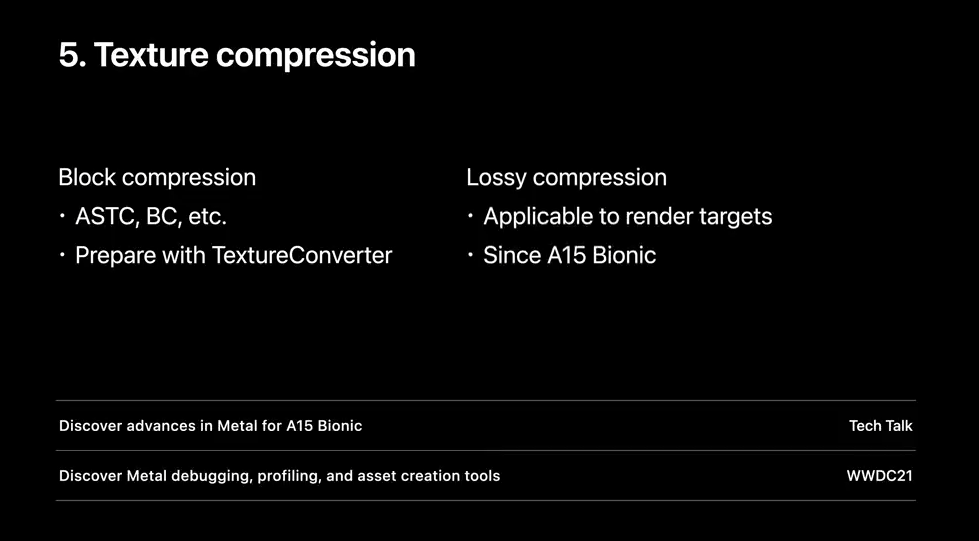
And lastly, some read-only textures may benefit from block compression for lower memory use.
For block compressed pixel formats, there are options such as ASTC and BC.
Additionally, since A15 Bionic, you can use lossy compression for textures and render targets to save memory while preserving quality wherever possible.
Please check out these previous videos for more details.
And those are some of the memory savings you can quickly discover from using Memory Viewer.
But there are a few additional techniques you may take to further optimize your game.
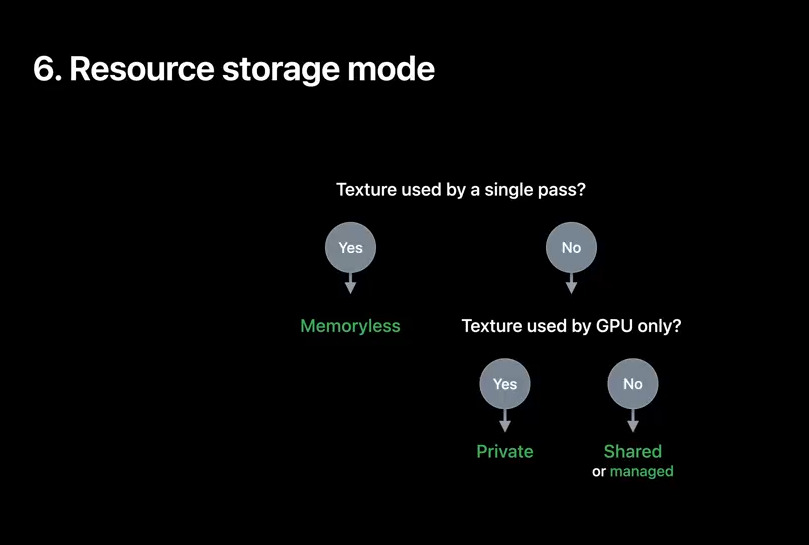
If a texture is only used by single pass, you can set its storage mode to memoryless to save memory and bandwidth.
Memoryless textures work well for temporary render targets, like depth, stencil, or multi-sampled textures.
Otherwise, if the texture is only used by the GPU, you can set its storage mode to private, or else shared or managed.
As a reminder, managed mode is not needed on Apple silicon Macs, just like on iPhone and iPad.
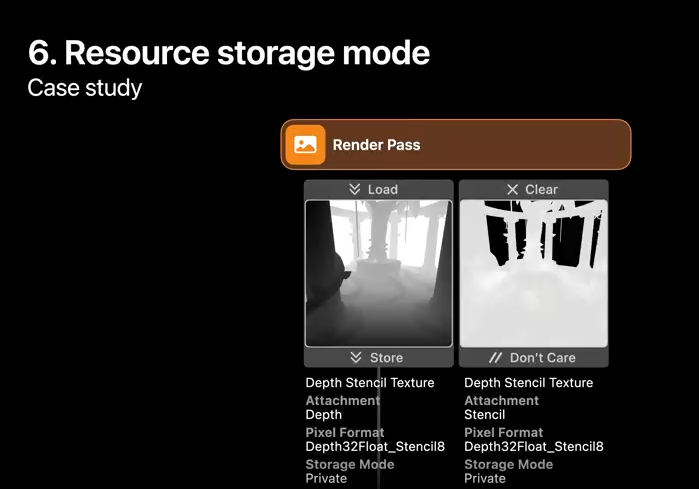
Here's an example case.
The game has a Depth32Float_Stencil8 texture.
The depth texture is used across passes, but the stencil texture's content is discarded and won't be used later in the frame.
So instead, the game could use two textures and make the stencil texture memoryless, to save memory and bandwidth.
Lastly, I'd like to mention another technique that might be interesting to you for making the most out of the memory in your game.
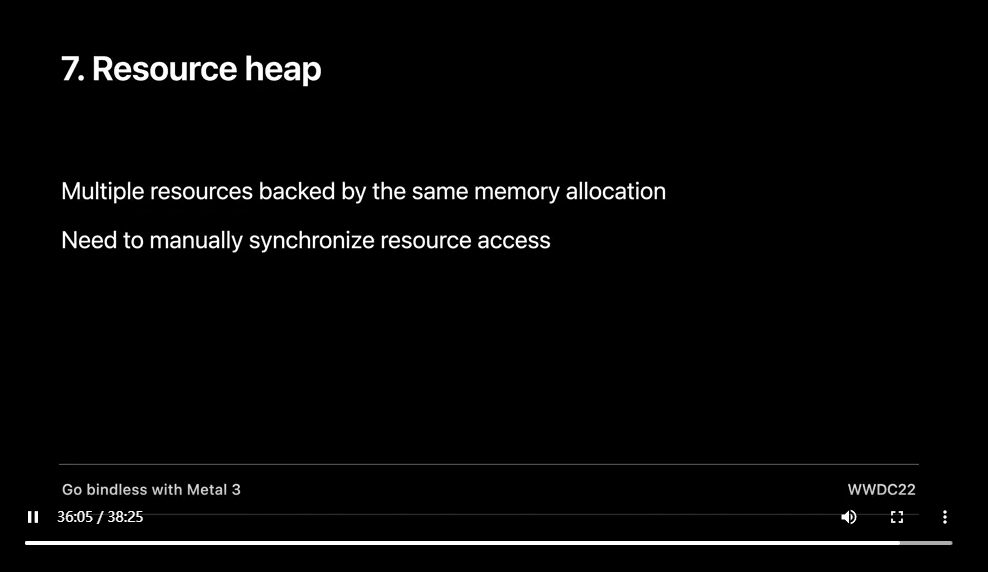
You may use aliased resources from a heap if your game doesn't use them at the same time.
They can share the memory backed by the same allocation.
But be extra careful when synchronizing the accesses to those resources.
You can check out the "Go bindless with Metal 3" talk to learn more about using resources allocated from a heap.
So that wraps up our checklist of memory savings.
And I hope this checklist will help you audit the Metal resources in your game.
To learn more about using Metal Debugger for optimizing your game memory, please check out these other WWDC talks.
Today, we took a guided tour and explored many interesting things you can do to understand and improve your game's memory usage.
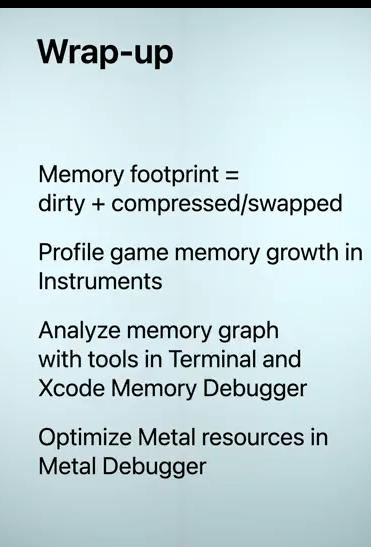
First, memory footprint is the primary metric in understanding your game's memory usage, and it includes dirty plus compressed and swapped memory.
Then, we experienced powerful memory debugging tools.
Seth showed us how Instruments empower memory profiling with useful telemetry tracks.
The new Game Memory template is exactly tailored for this job.
After that, I presented memory graph to store a snapshot of game memory state.
There are flexible and powerful command line programs to analyze memory graphs for objects, references, and allocation history.
Improvements in the heap tool and redesigned Xcode Memory Debugger will supercharge game memory analysis.
Lastly, Seth shared a memory savings checklist for Metal resources, and how Metal Debugger can help answer questions about Metal resource usage in your game.
You could also learn more from other WWDC sessions, documentation, and manual pages.
We are constantly advancing our best and most flexible tools for you.
So why not try them out? They may just be what you are looking for.
And don't hesitate to share with us any feedback you may have, via any channels such as the Feedback Assistant.
Have fun in your memory journey, and thanks for watching.
虽然并非全部原创,但还是希望转载请注明出处:电子设备中的画家|王烁 于 2022 年 7 月 21 日发表,原文链接(http://geekfaner.com/shineengine/WWDC2022_TargetandoptimizeGPUbinarieswithMetal3.html)